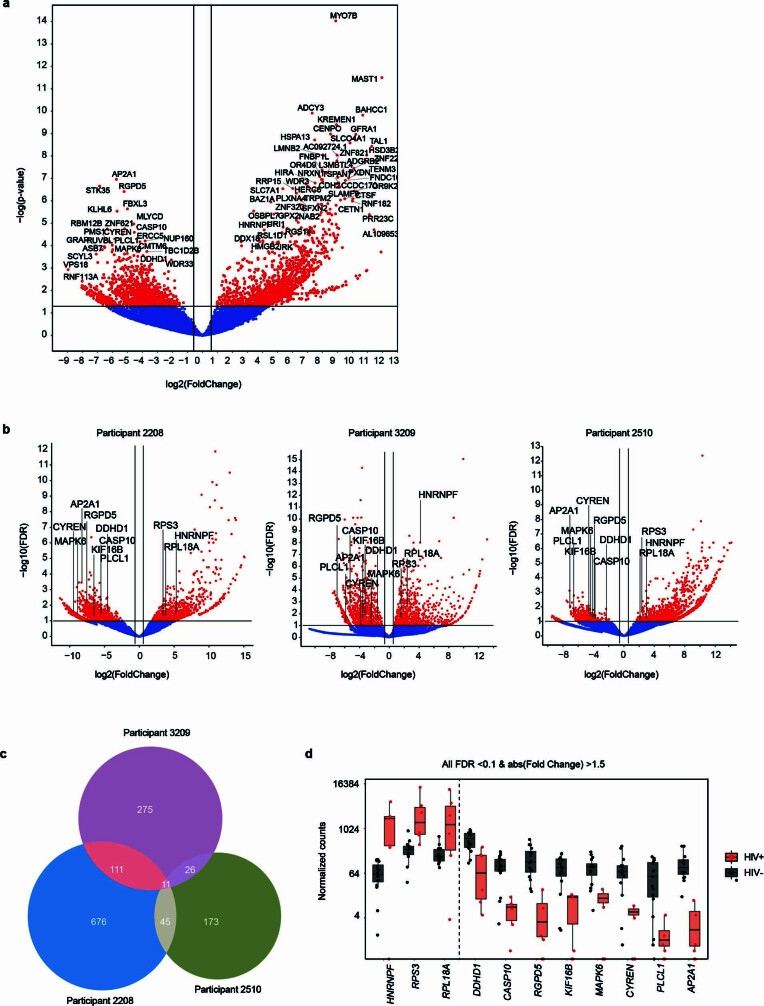
Extended Data Fig. 5. Host gene expression by HIV DNA+ and HIV DNA− memory CD4 T cells under ART.
(a) Volcano plot of DGE between HIV DNA+ and HIV DNA− cells from DGE analysis that considered samples from participants as biological replicates. Genes showing Fold Change >1.5 and FDR ≤0.05 between HIV DNA+ and HIV DNA− cells are highlighted in red. (b) DGE between HIV DNA+ and HIV DNA− cells, analysed separately in each participant. Genes with absolute fold change >1.5 and p ≤0.1 are highlighted in red. Labels indicate DEGs that were common to all three participants. (c) Overlap of DEGs (absolute fold change ≥1.5, p ≤0.1) between HIV DNA+ and HIV DNA− after separate analysis of each participant. (d) RNA expression of DEGs that were common to all participants. Each plotted point indicates the expression level of the given gene in a single sorted sample (n = 16 biologically independent HIV DNA− and 6 biologically independent HIV DNA+ samples). Box plots indicate the median with the lower and upper hinges corresponding to the 25th and 75th percentiles and whiskers corresponding to 1.5 x the interquartile range.

