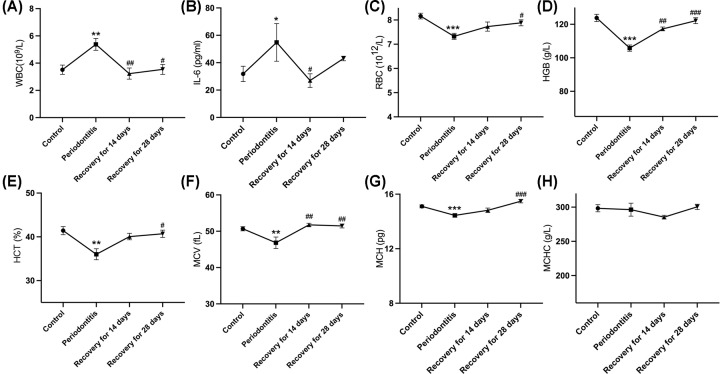
Figure 4. Hematologic analyses.
Mean WBC counts (A), serum IL-6 concentrations (B), RBC (C), HGB (D), HCT (E), MCV (F), MCH (G), and MCHC (H) of mice in the control group, in the ligature-induced periodontitis group, in the recovery for 14 days group and those in the recovery for 28 days (n=10 in each group). Data are presented as mean ± SD. Between-group comparisons were performed using ANOVA test; *P<0.05, **P<0.01, ***P<0.001 as compared with the control group; #P<0.05, ##P<0.01, ###P<0.001 as compared with the periodontitis group.

