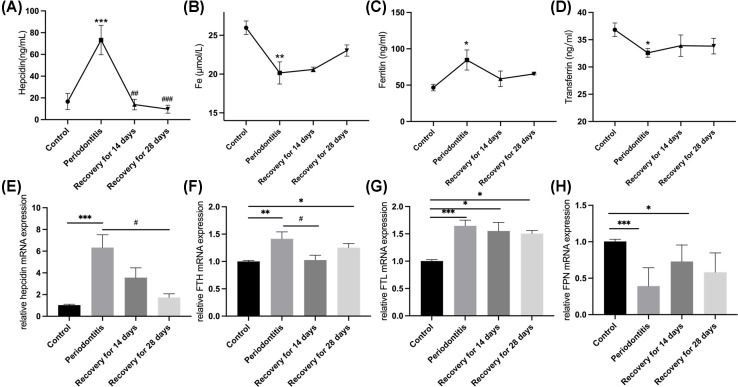
Figure 5. Iron metabolism analyses.
Serum hepcidin (A), Fe (B), ferritin (C), transferrin (D) concentrations; mRNA expression levels of iron metabolism genes hepcidin (E), FTH (F), FTL (G), and FPN (H) in livers of the control group, in the ligature-induced periodontitis group, the recovery for 14 days group and those of the recovery for 28 days group (n = 10 in each group). Data are presented as mean ± SD. Between-group comparisons were performed using ANOVA test; *P<0.05, **P<0.01, ***P<0.001 as compared with the control group; #P<0.05 as compared with the ligature group.

