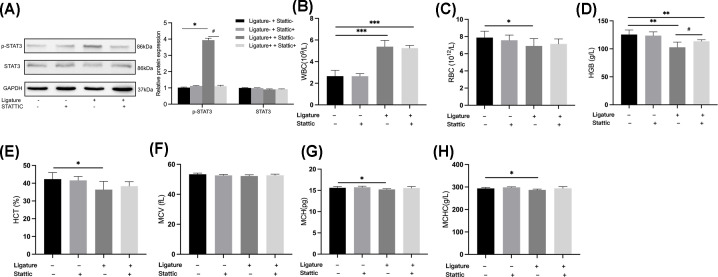
Figure 7. Inhibition effect of Stattic and hematologic analyses under the application of Stattic.
(A) Left: Western blot analysis of liver biomarkers of JAK-STAT signaling pathway; right: quantification of band intensities, mean WBC counts (B), RBC (C), HGB(D), HCT (E), MCV (F), MCH (G,) and MCHC (H) of mice in the control group, in the STATTIC group, in the ligature group and those in the combined of ligature and STATTIC application group (n=10 in each group). Data are presented as mean ± SD. Between-group comparisons were performed using ANOVA test; *P<0.05, **P<0.01, ***P<0.001 as compared with the control group; #P<0.05 as compared with the ligature group.

