Figure 2.
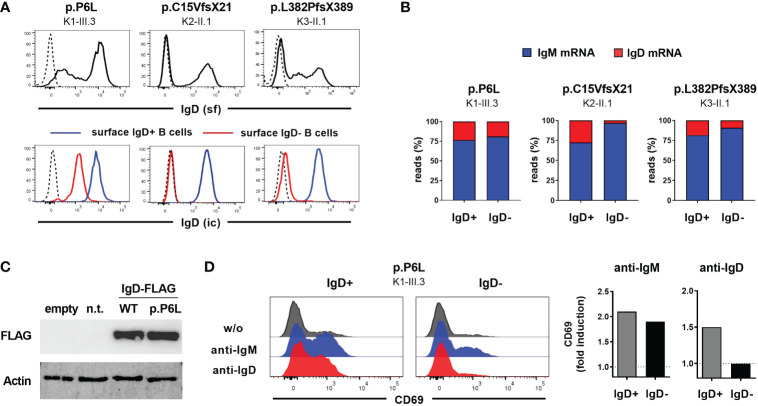
Characterization of IGHD variants reveal loss-of-expression or loss-of-function (A) Flow cytometric analysis of surface IgD expression on CD19+CD27-IgM+ naïve B cells from 3 individuals carrying different heterozygous IGHD variants (upper row). Intracellular IgD expression within surface IgD+ (blue line) or surface IgD- (red line) CD19+CD27-IgM+ naïve B cells from the same individuals (lower row). Dashed lines represent isotype controls. (B) Proportion of unique IgM or IgD sequence reads assessed by RNA-based IgH high-throughput sequencing within sorted CD19+CD27-IgM+CD10- IgD+ or IgD- mature naïve B cells from 3 individuals carrying different heterozygous IGHD variants (C) Immunoblot analysis of IgD Expression in 293T cells not transfected (n.t.) or transfected with an empty vector or an IgD-FLAG expression vector with wild type IgD sequence or the p.P6L variant. (D) Histograms showing flow cytometric analysis of CD69 expression on sorted IgD+ or IgD- CD19+CD27-IgM+ naïve B cells from an individual carrying the p.P6L IGHD variant stimulated in vitro with anti-IgM or anti-IgD for 48 hours. Fold induction (stimulated versus non-stimulated) of CD69 expression is shown on the right.

