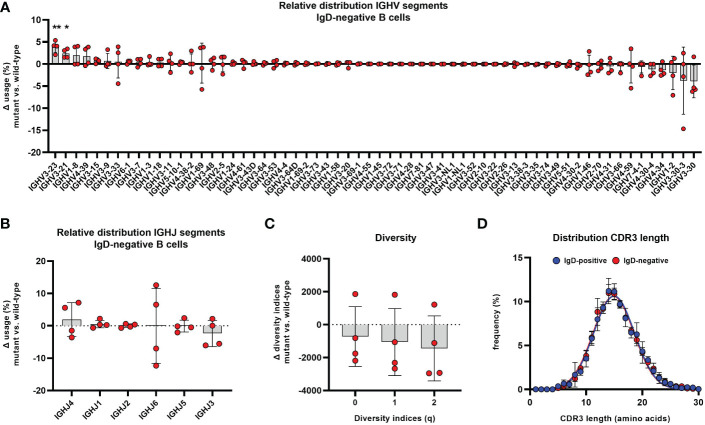
Figure 7.
Altered distribution of VH segments in the IgD-negative mature naïve B cell population Distribution of different VH (A) and JH (B) segments used in CD19+CD27-CD21+CD10-IgM+IgD- mature naïve B cells is shown as relative difference compared to the matched IgD+ counterpart. Symbols represent the Δ frequency IgD-/mutant versus IgD+/wild-type from individual samples and bars the mean ± SEM. VH and JH segments are ordered on the x-axis according to their mean relative difference (*, p < 0.05; **, p < 0.01; one sample t-test with hypothesized mean of 0). (C) Representation of species richness (q=0), Shannon diversity index (q=1) and Simpson diversity index (q=2) is shown as difference between IgD- and IgD+ B cell subsets. Symbols represent the Δ value IgD-/mutant versus IgD+/wild-type of each parameter from individuals samples and bars the mean ± SEM. (D) Distribution of CDR3 IgH length in IgD+ (blue) and IgD- (red) mature naïve B cells. Each symbol represents the mean frequency ± SEM of a distinct CDR3 length.

