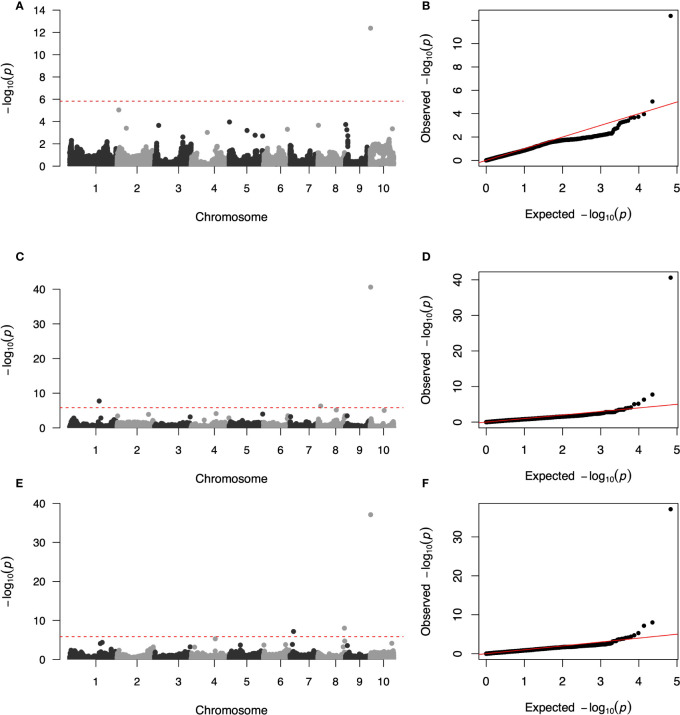
Figure 3.
Genome-wide association study Manhattan and quantile–quantile (q–q) plots for Southern Corn Rust (SCR) resistance. (A, C, E) Manhattan plots for SCR resistance in additive GWAS in DH panel, additive and dominant GWAS in hybrid panel, respectively. the dashed line corresponds to the threshold level defined at P = 1.47 × 10⁻⁶ by a false discovery rate correction method. (B, D, F) q–q plot for SCR resistance in additive GWAS in DH panel, additive and dominant GWAS in hybrid panel, respectively.

