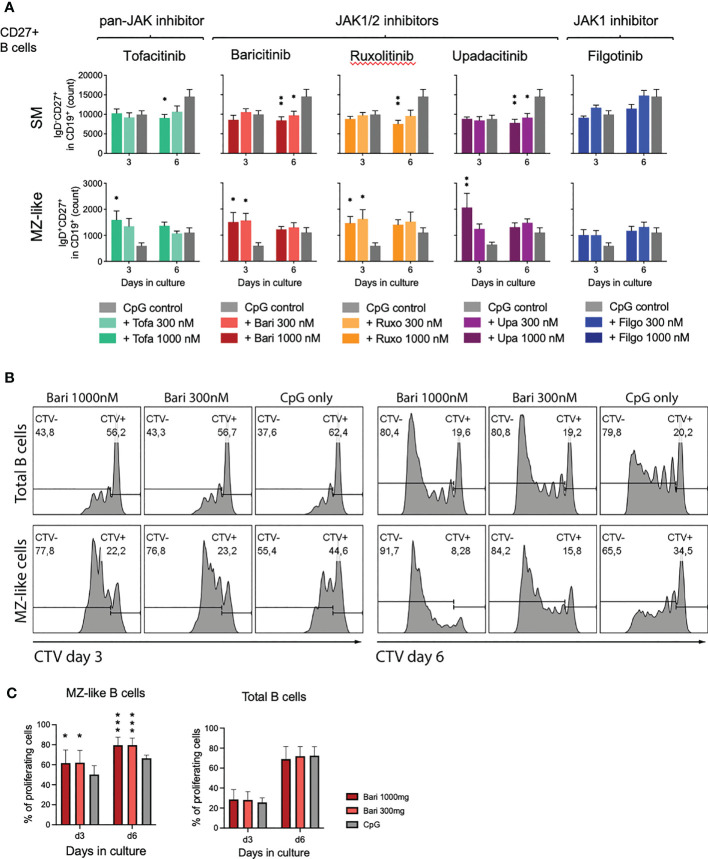
Figure 4.
Expansion of MZ-like cells due to proliferation of pre-existing cells. (A): Isolated CD27+ B cells were activated with CpG on day 0 and cultured in the absence or presence of indicated concentration of JAK inhibitors. On day 3 and 6, B cell subpopulations were analyzed by time acquisitioned flow cytometry. Data shown as mean ± SEM of 3 independent experiments, each in triplicate. ANOVA with Dunnett’s multiple comparisons test as follow-up test. *p < 0.05, **p < 0.005 indicate significant differences of JAK inhibitors compared to CpG control. For gating strategy and exemplary plots also see Supplementary Figure 4 . (B+C): Cell Trace Violet (CTV) stained, primary total B cells were activated with CpG on day 0 and cultured in the absence or presence of indicated concentration of baricitinib. B cells were analyzed by flow cytometry on days 3 and 6. Exemplary plots depicted, CTV-: proliferating B cells; CTV+: non-proliferating B cells (B). Three independent experiments, performed in triplicates, student’s t-test. *p < 0.05, ***p < 0.0005 indicate significant differences of JAK inhibitors compared to CpG control (C).

