Figure 5.
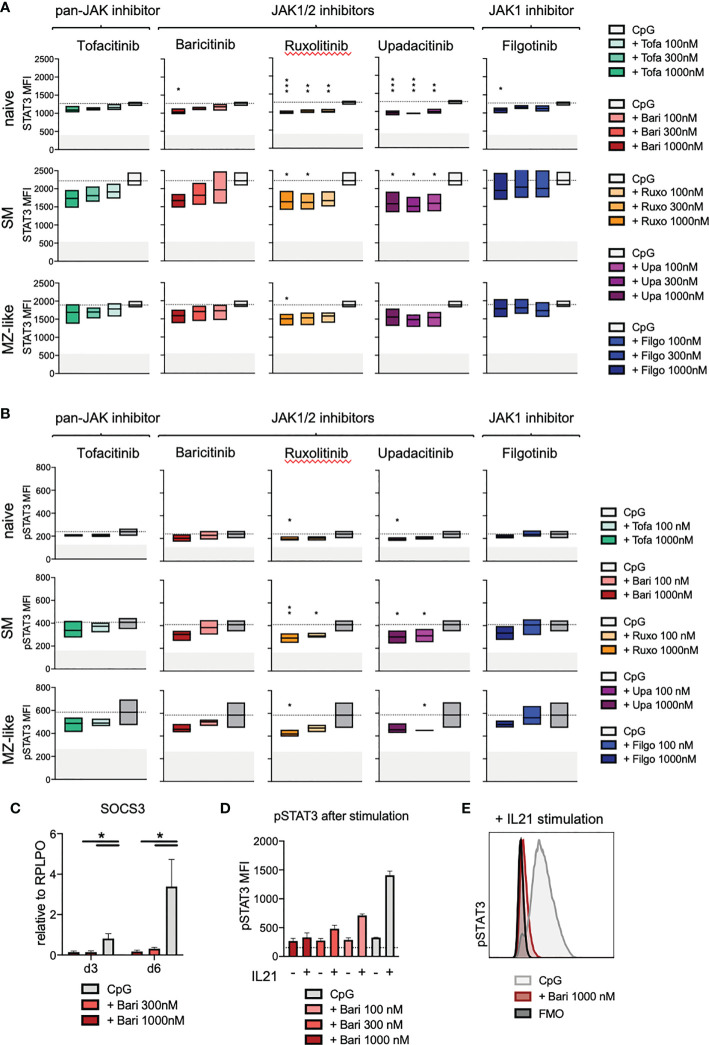
STAT3 expression and phosphorylation under JAK inhibitor treatment. Primary total B cells stimulated with CpG on day 0 and treated with scalar doses of JAK inhibitors as indicated, intracellular staining performed on day 3 of culture. (A): STAT3 expression in CD19+ B cells analyzed by flow cytometry. Data of 3 independent experiments, depicted as floating bars (min to max) of STAT3 mean fluorescence intensity. ANOVA with Dunnett’s multiple comparisons test as follow-up test. *p < 0.05, **p < 0.005, ***p < 0.0005, indicate significant differences of JAK inhibitors compared to CpG control. (B): Basal phosphorylation (without further stimulation) of STAT3 in CD19+ B cells, analyzed by flow cytometry. Data of 3 independent experiments, with duplicates depicted as floating bars (min to max) with line at mean. ANOVA with Dunnett’s multiple comparisons test as follow-up test, *p < 0.05, **p < 0.005 indicate significant differences of JAK inhibitors compared to CpG control. (C): Expression of STAT3-target gene SOCS3 under baricitinib treatment assessed by qPCR. Data from 4 experiments depicted relative to B cell housekeeping gene RPLPO. ANOVA with Dunnett’s multiple comparisons test, *p < 0.05. (D, E): STAT3 phosphorylation under baricitinib treatment upon additional stimulation of B cells with IL-21. IL-21 was added to indicated wells 15 minutes before fixation of cells, otherwise as detailed above.

