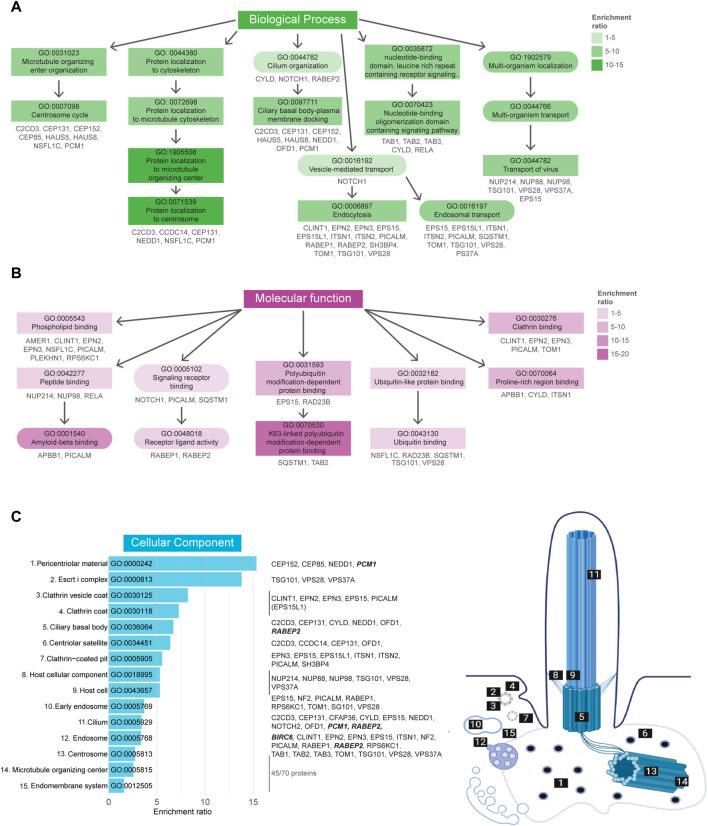
FIGURE 4.
Gene Ontology enrichment analysis of UBD dataset. (A) GO term enrichment for biological processes (BP) colored by their enrichment ratio. The 11 most enriched BP terms (Fisher’s exact test value ≤9.5E-5) are displayed (square) along with supporting GO terms (circle). Arrows indicate the related terms and the genes per term are indicated in grey. All upstream terms also include the genes from their downstream terms. (B) GO term enrichment analysis for molecular functions (MF) of which the 8 most enriched terms (Fisher’s exact test value ≤5.5E-3) are displayed as in (B). (C) The 15 most enriched terms (Fisher’s exact test value ≤7.5E-4) of the cellular components (CC) GO term enrichment analysis are displayed, ordered by their enrichment ratio. The cellular position of these terms and their related proteins are indicated on the right. The terms “Host cellular component” and “Host cell” do not directly refer to a ciliary localization, while their related proteins do (dashed line). The proteins related to the terms ‘Microtubule organizing center’ and ‘Endomembrane system’ were not indicated, as there were too many to clearly display, however a complete list of proteins can be found in Supplementary Table S1. Proteins indicated in bold italic letters were shared hits between UBD-PL and UAP.

