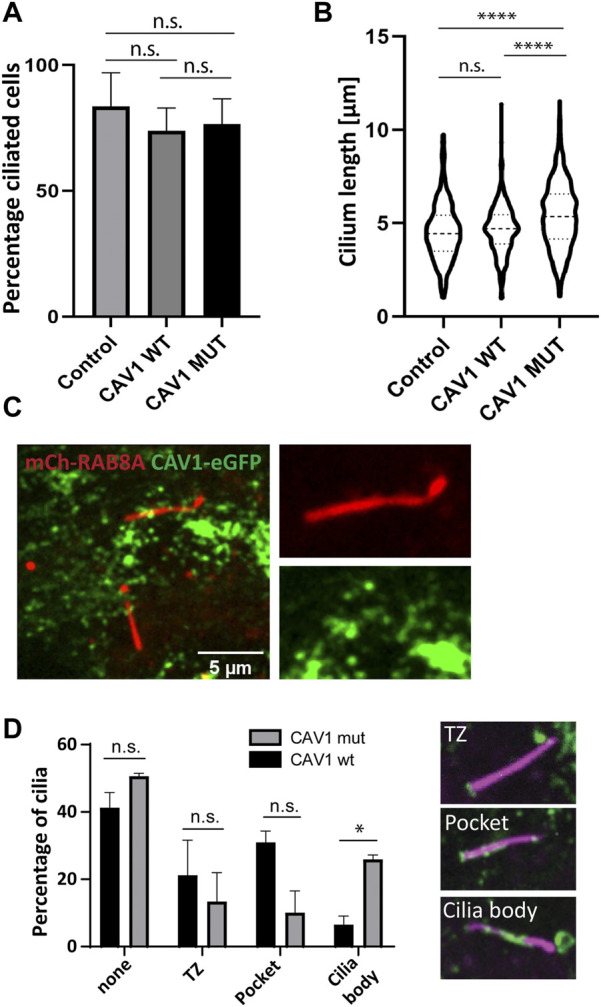
FIGURE 9.

Ciliary length but not ciliation affected in CAV1 mutant lines. Three biological replicates and three technical replicates were imaged in order to determine ciliation levels and ciliary length in RPE1 Flp-In cells stably expressing eGFP-tagged CAV1 wild-type (CAV1 WT), or a CAV1 ubiquitination-impaired mutant (CAV1 MUT), and an untransfected control (Control). ARL13B was used as a marker for the ciliary length. The ALPACA tool was used to quantify both parameters. (A) The levels of ciliation between the three lines did not differ significantly. The percentage of ciliated cells was as follows: Control - 83%, CAV1 WT - 73%, and CAV1 MUT - 76%. Error bars indicate mean with SD. (B) A significant difference (p < 0.0001) in cilia length was observed between the CAV1 MUT (cilia counted = 589), as compared to both the CAV1 WT (cilia counted = 422) and Control lines (cilia counted = 341). The latter did not differ from each other significantly. (C) A single time frame from live cell imaging of RPE1 CAV1-eGFP MUT cells stably expressing RAB8A-mCherry. (D) Comparison of CAV1-eGFP WT and CAV-eGFP MUT cilia localization imaged as in (C). Total of 78 (WT) or 77 (MUT) cilia were imaged and quantified. Localization was classified as shown: none for no cilia association, TZ for transition zone only localization, Pocket localization includes the transition zone and the pocket, and Body for lump-like localization on the ciliary body (as seen in C). Significance based on p < 0.05.
