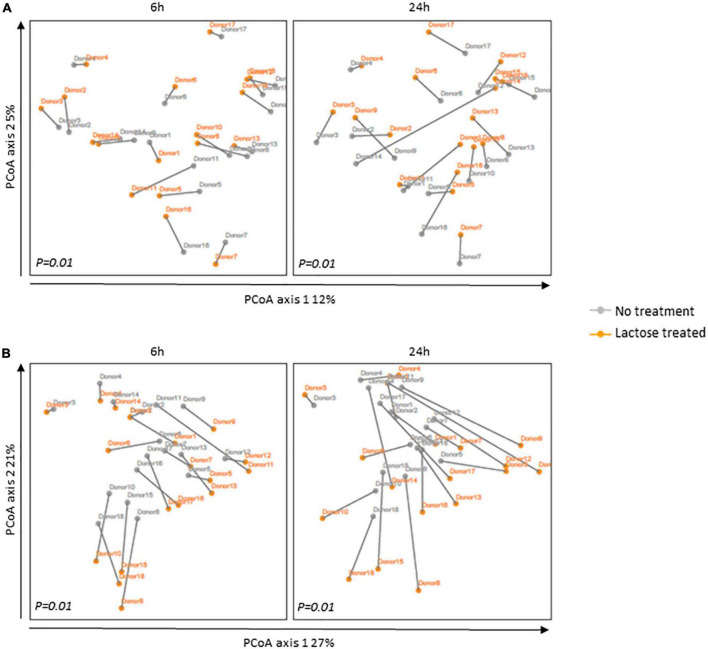
FIGURE 2.
Principal coordinates analysis (PCoA) based on (A) unweighted and (B) weighted UniFrac distances for the 6- and 24-h timespoints post-inoculation. The communities for each donor are portrayed separately with the gray line indicating their distance. Statistical differences between no treatment and lactose treated groups were determined using PERMANOVA and P-values are indicated at the bottom of each box.

