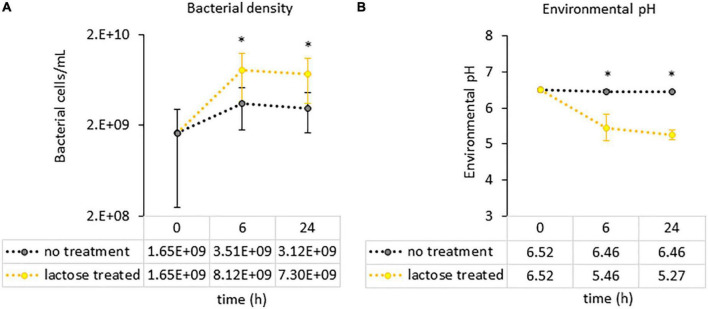
FIGURE 4.
Measurements of culture parameters (A) bacterial load and (B) environmental pH. Each circle represents the average count with error bars indicating standard deviation. Statistical differences were determined via a Student’s t-test between the no treatment and lactose treated groups. P-values that are < 0.05 are indicated with an asterisk*.

