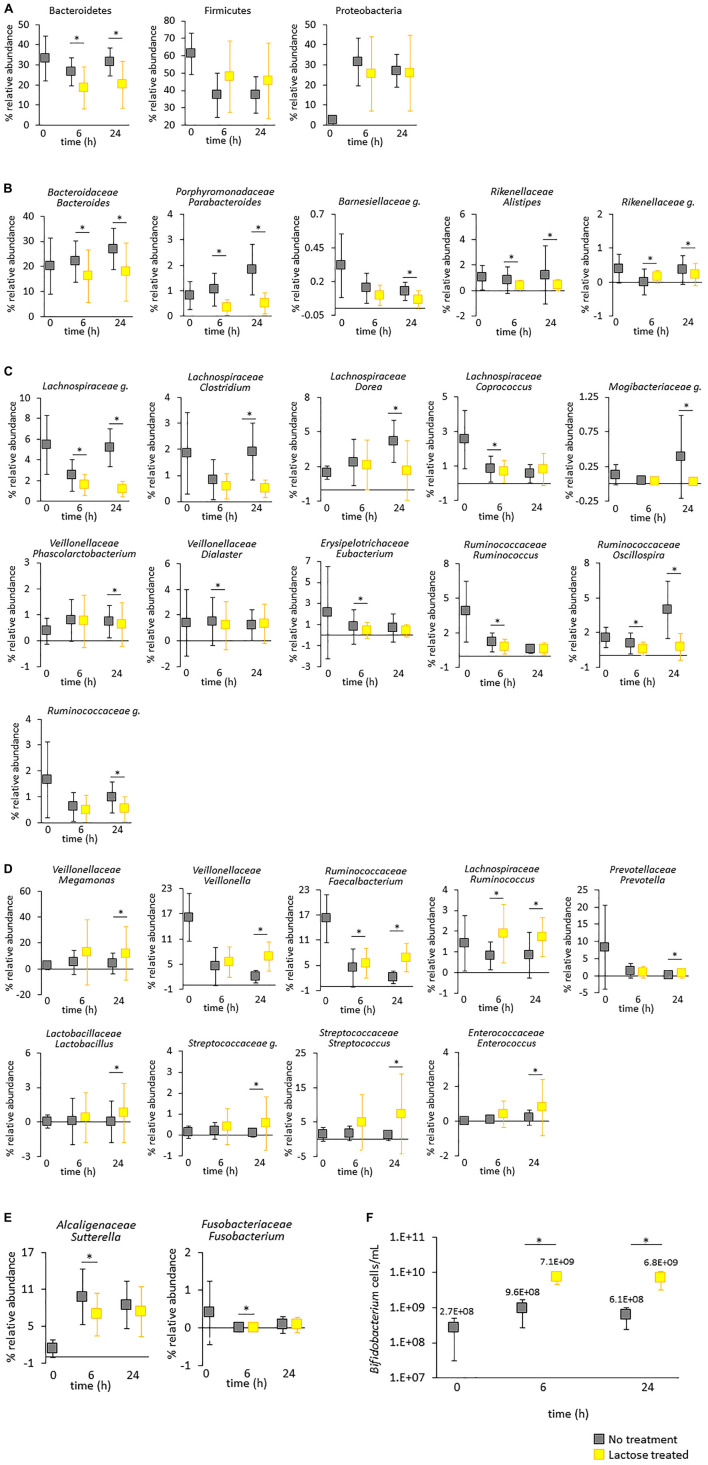
FIGURE 5.
Taxa impacted by lactose treatment. The figures show the average abundance for all donors with standard deviation. (A–E) Relative abundance based on 16S rRNA gene sequencing. Statistical differences between the untreated and lactose treated groups was determined using a linear model, adjusted for false discovery rate using the Benjamini–Hochberg method, and are annotated with an asterisk*. (A) Phylums Bacteroidetes, Firmicutes, and Proteobacteria. (B) Taxa within phylum Bacteroidetes. (C) Taxa within phylum Firmicutes that increased and (D) decreased due to lactose treatment. (E) Taxa within phylums Proteobacteria and Fusobacteria. (F) Levels of Bifidobacterium genus were quantified via qPCR. Statistical differences between the no treatment and lactose–treated groups were determined via a Student’s t-test. P-values that are < 0.05 are indicated with an asterisk*.

