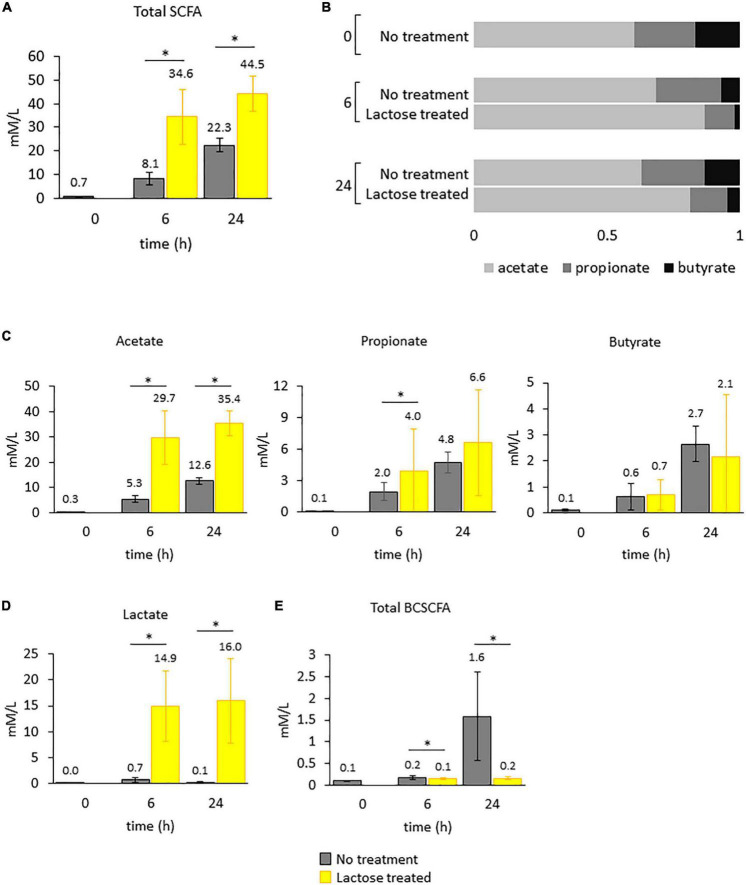
FIGURE 6.
Levels of metabolic products were quantified for each donor over time. Bars in the figure represent the average amounts detected with standard deviation. Statistical differences were determined via a Student’s t-test between the no treatment and lactose treated groups. P-values that are < 0.05 are indicated with an asterisk*. (A) Total SCFAs. (B) Ratios of acetate to propionate to butyrate. (C) Acetate, propionate, and butyrate. (D) Lactate. (E) Total BCSCFA.

