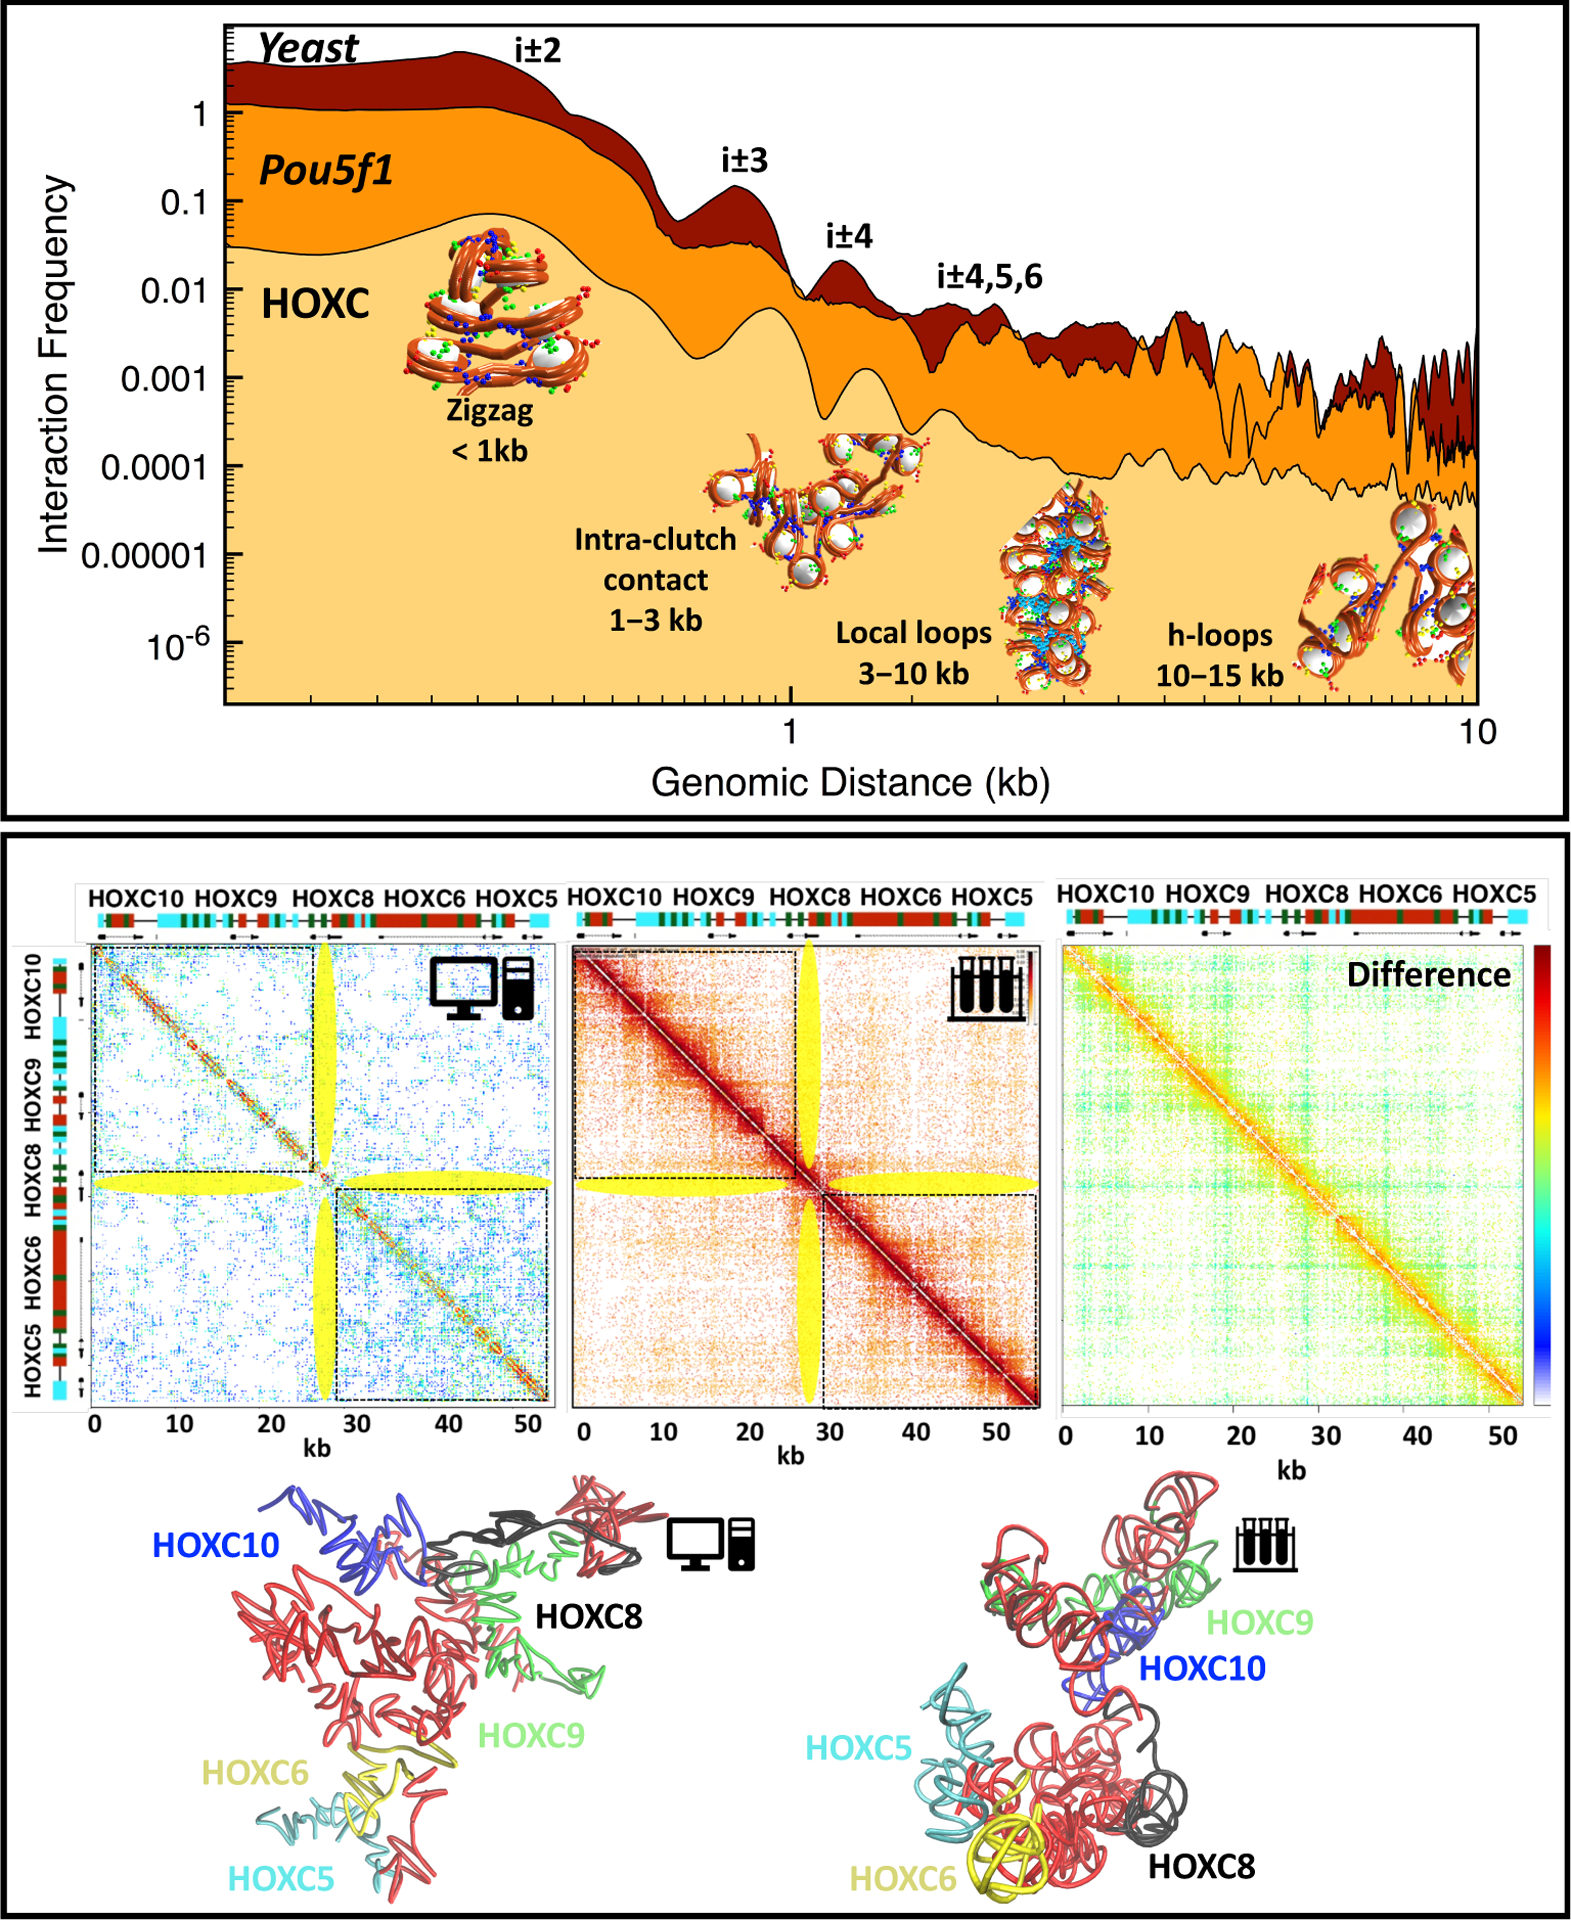
Figure 4: Conserved structural motifs and life-like folding by in silico gene folding.

Top: Internucleosome interaction contact frequencies for HOXC [146]**, Pou5f1 [13], and yeast 30 kb genome region [149]. Structural peaks are annotated as follows: short-range contacts (<1 kb) measure next-neighbor interactions common in zigzag fibers; contacts in the 1–3 kb range arise from intra-clutch interactions; chromatin loops between neighboring clutches account for 3- to 10-kb contacts; and hierarchical loops [19] account for 10- to 15-kb contacts. Bottom, left to right: Computational contact map of the modeled HOXC from [146], experimental Micro-C map of mESC from [148], and the difference map between the computational and experimental maps. The HOXC gene locations are marked alongside the maps, with acetylation and LH-rich regions colored red and turquoise, respectively. Stripe regions are highlighted in yellow. At bottom, from left to right, are the HOXC configurations obtained in [146]** and from the Micro-C map from [148]. For the latter, we created a polymer model of 508 beads (equal to the length of the HOXC region in the Micro C map) corresponding to ~51 kb, and positioned the beads using the nucleosome and DNA beads coordinates in the initial configuration of HOXC in [146]**. Experimental Micro-C interactions from [148] were used directly to form harmonic “bonds” between connected and non connected beads, the latter 1.5 times longer, similar to Lappala et al. [143]. A cutoff was used to retain major Micro-C interactions. The22 structure was then energy minimized subject to those harmonic bond restraints.
