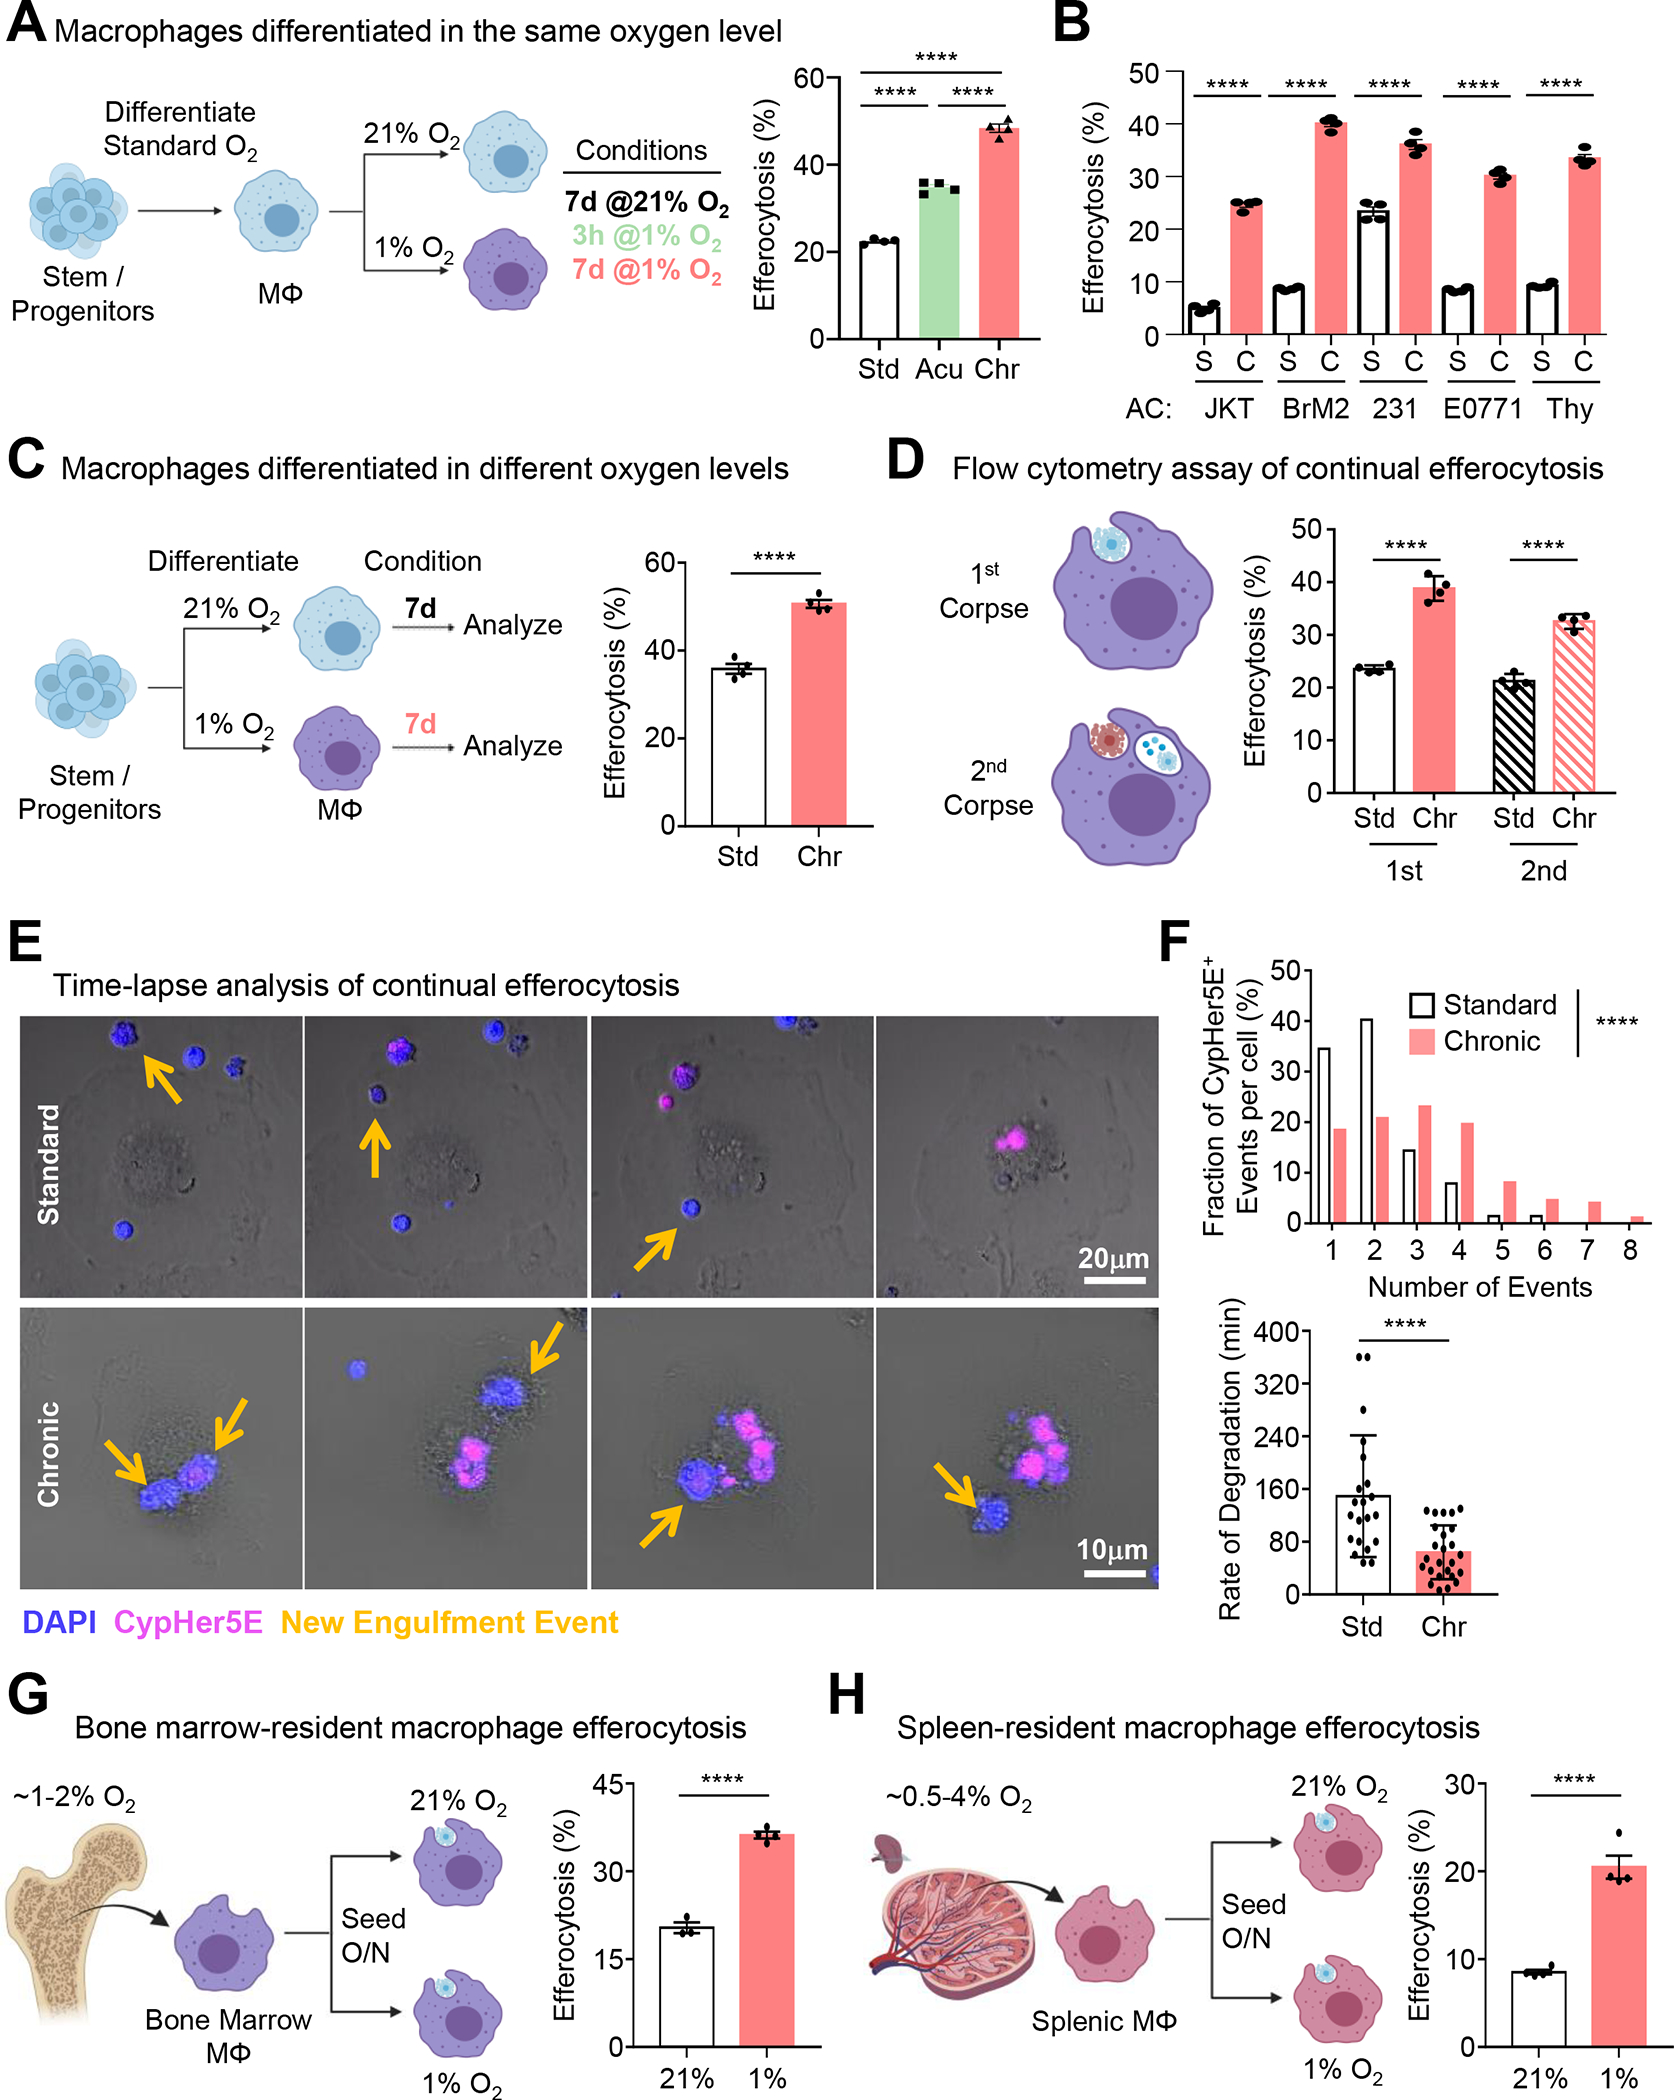
Figure 1: Efferocytosis is enhanced under prolonged (‘chronic’) physiological hypoxia.

(A) Conditioned macrophages (left) were co-cultured with CypHer5E-labeled apoptotic MDA-MB-231s for 1h, then assessed via flow cytometry. Data are from four independent experiments, shown as mean ± SEM.
(B) Experiments performed as in (A), with the following targets: Jurkats, BrM2s, MDA-MD-231s, E0771s, and thymocytes. Data are from four independent experiments, shown as mean ± SEM.
(C) Conditioned macrophages (left) were co-cultured with CypHer5E-labeled apoptotic MDA-MB-231s for 1h, then assessed via flow cytometry. Data are from three independent experiments, shown as mean ± SEM.
(D) Experiments performed as in (A) but used to assess continual efferocytosis. Data are from three independent experiments, shown as mean ± SEM.
(E, F) Experiments performed as in (A), but imaged via time-lapse confocal microscopy. Yellow arrows indicate newly internalized ACs. (F) Quantification of CypHer5E+ events (top) and rate of degradation of internalized ACs (bottom). For quantification, 115 efferocytotic macrophages from 8 standard oxygen scenes and 155 efferocytotic macrophages from 6 chronic hypoxia scenes were analyzed. Data were binned as number of events per-cell and presented as a fraction of 100%. For analysis of degradation rate, 21 (standard oxygen) and 25 (chronic hypoxia) efferocytotic macrophages were analyzed. Degradation time = time to shrink internalized AC 50% after acidification (CypHer5E+).
(G, H) Bone marrow (G) or splenic (H) macrophages were isolated and seeded at either 1% or 21% oxygen overnight, then co-cultured with CypHer5E-labeled apoptotic MDA-MD-231 cells for 1h. Efferocytosis was assessed via flow cytometry. Data are from four independent experiments, shown as mean ± SEM.
Significance was determined by Student’s t-test in C,F-H, and by one-way ANOVA in A,B,D,F, ****p < .0001.
