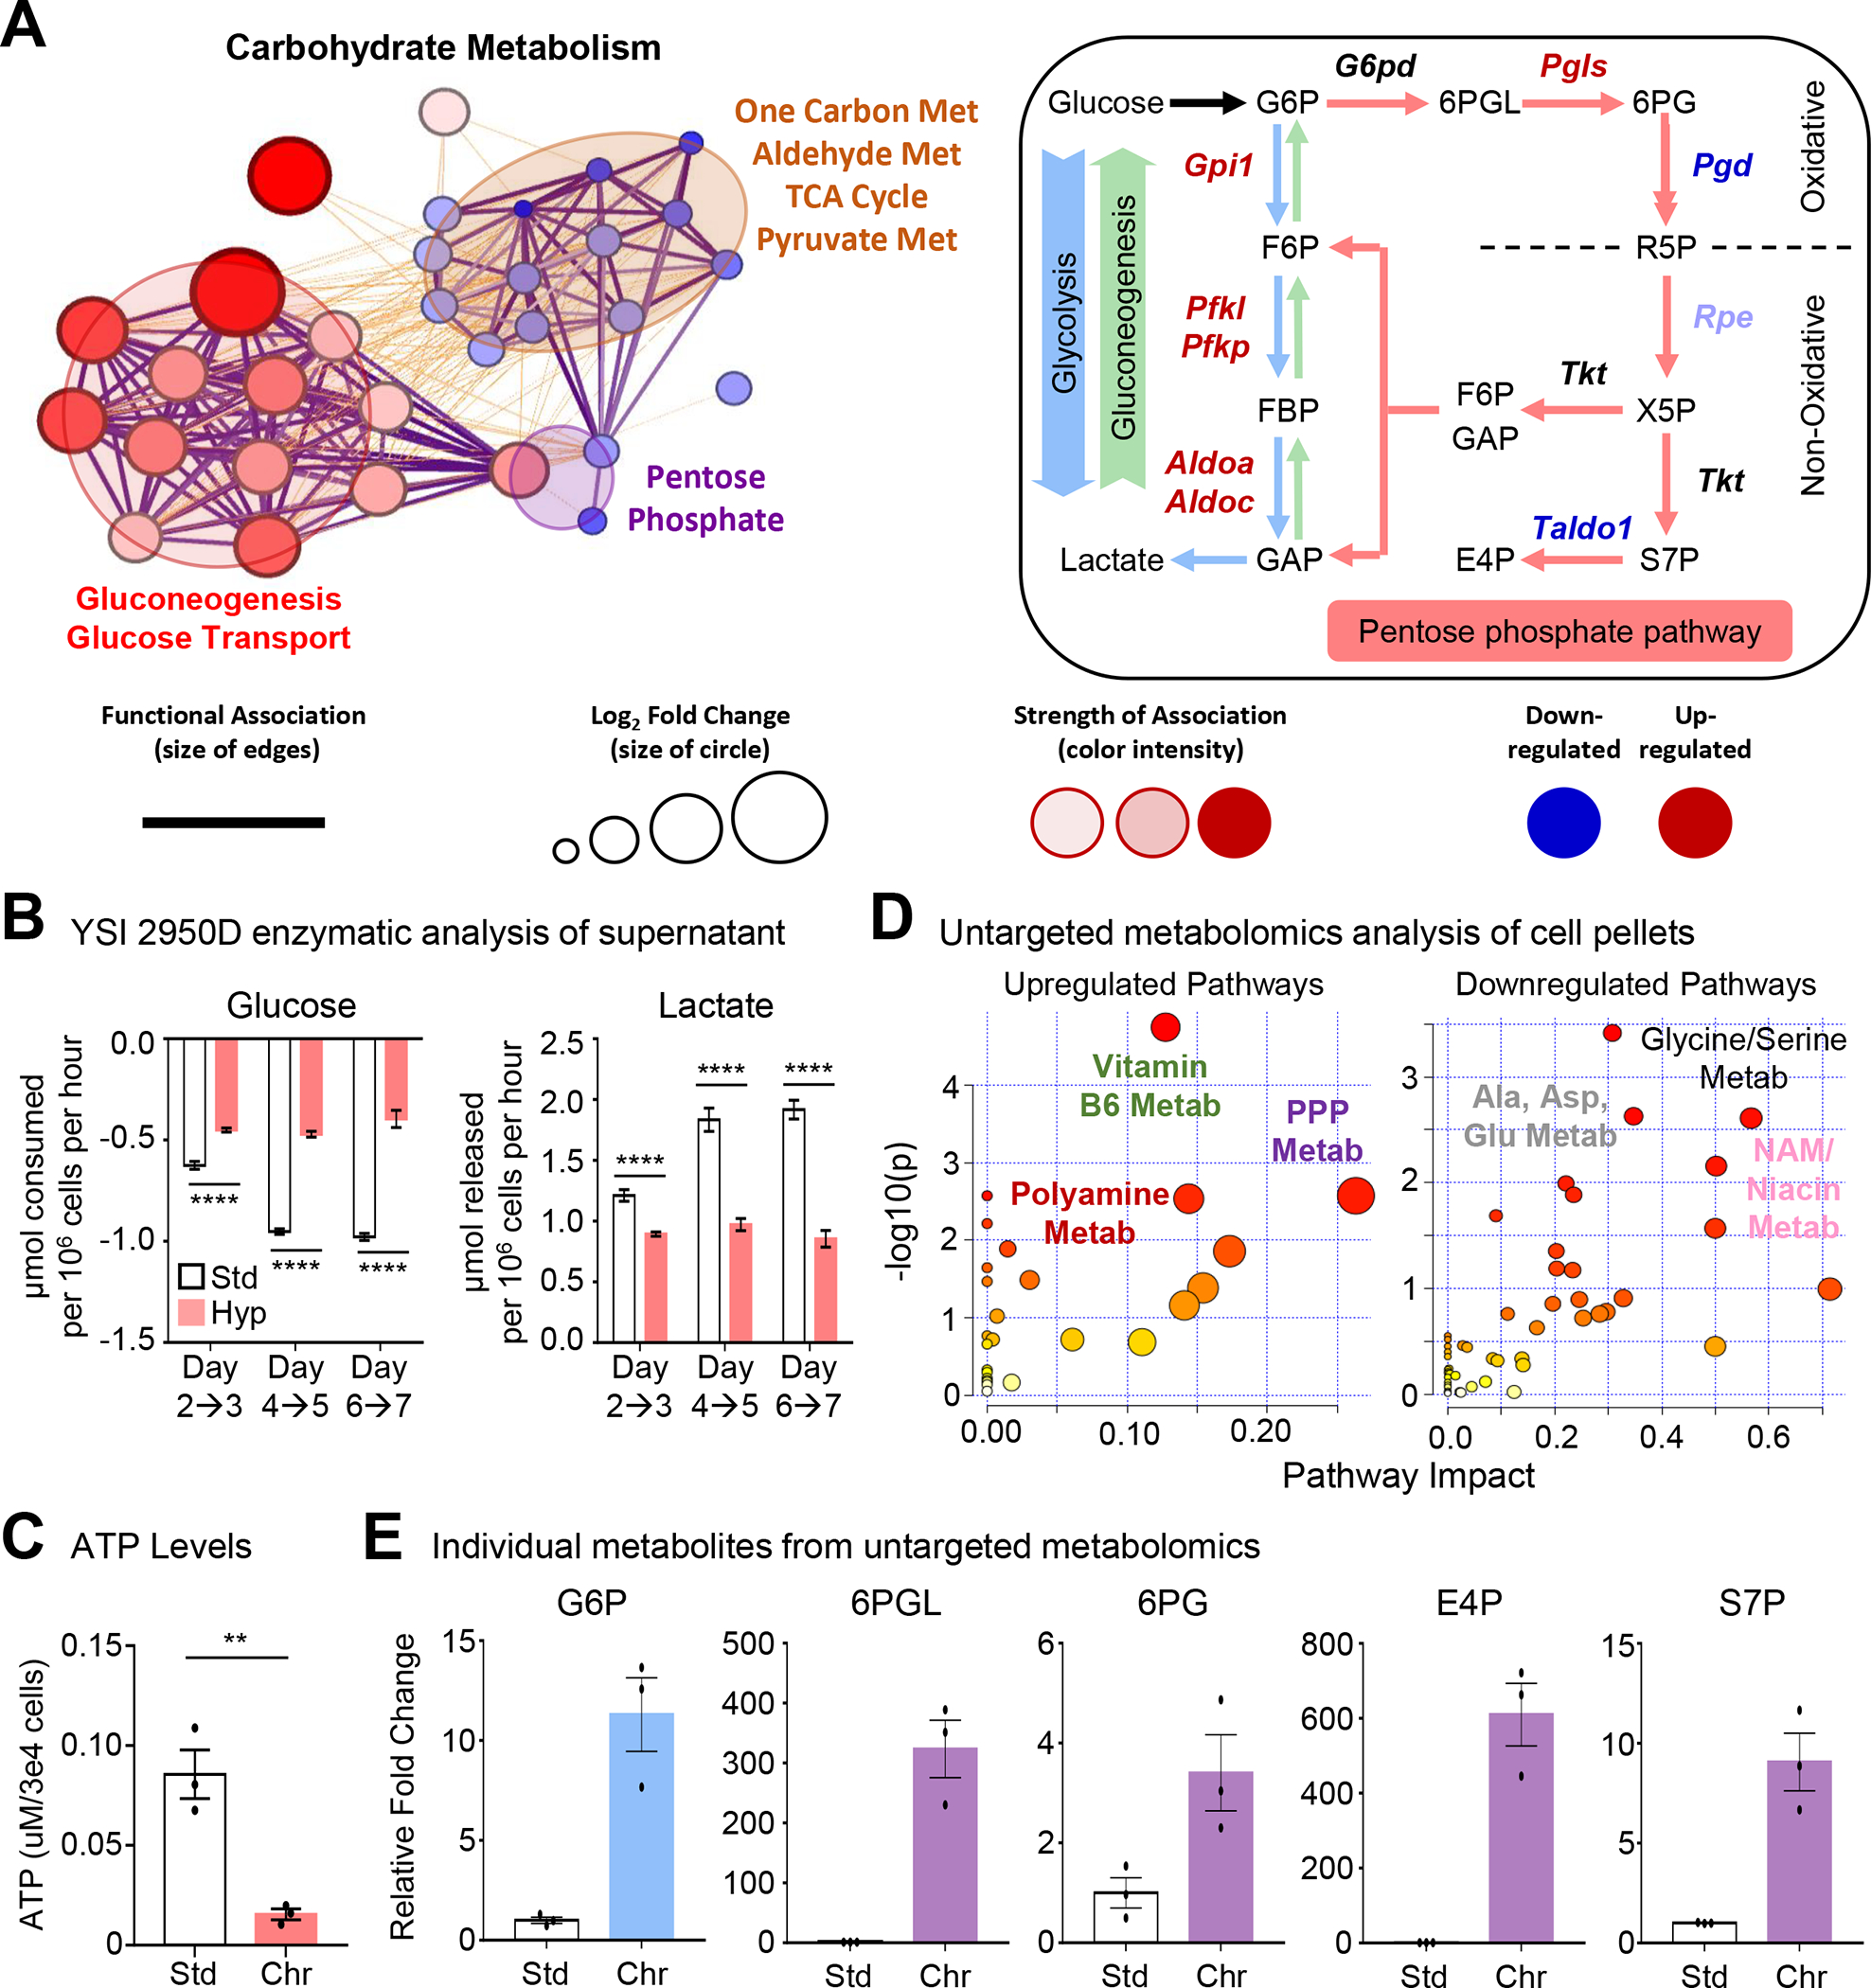
Figure 4: Metabolic pathway use in chronic physiological hypoxia-conditioned macrophages.

(A) (Left) Differentially regulated metabolic genes (Figure 2) are represented using network analysis. (Right) Schematic of routes of glucose use. Genes in red are significantly upregulated whereas genes in blue are downregulated.
(B) Macrophages cultured as in Figure 1A but with glucose and lactate media levels in the media analyzed. Data is from two independent experiments, with four biological replicates per experiment. Data are shown as mean ± SEM.
(C) Macrophages cultured as in Figure 1A but analyzed for cellular ATP levels. Data is from three independent experiments, shown as mean ± SEM.
(D) Macrophages cultured as in Figure 1A then isolated for untargeted metabolomic analysis. (Left) upregulated and (Right) downregulated pathways in chronic hypoxia-conditioned macrophages are shown. Three independent experiments were performed for each condition.
(E) Shown are representative metabolites from Figure 4C. Data are shown as mean ± SEM. All metabolites are significant, p < .0001. G6P, glucose 6-phosphate. 6PGL, 6-phosphogluconolactone. 6PG, 6-phosphogluconate. E4P, erythrose 4-phosphate. S7P, sedoheptulose 7-phosphate.
Significance was determined by Student’s t-test in C, and by one-way ANOVA in B, **p < .01, ****p < .0001.
