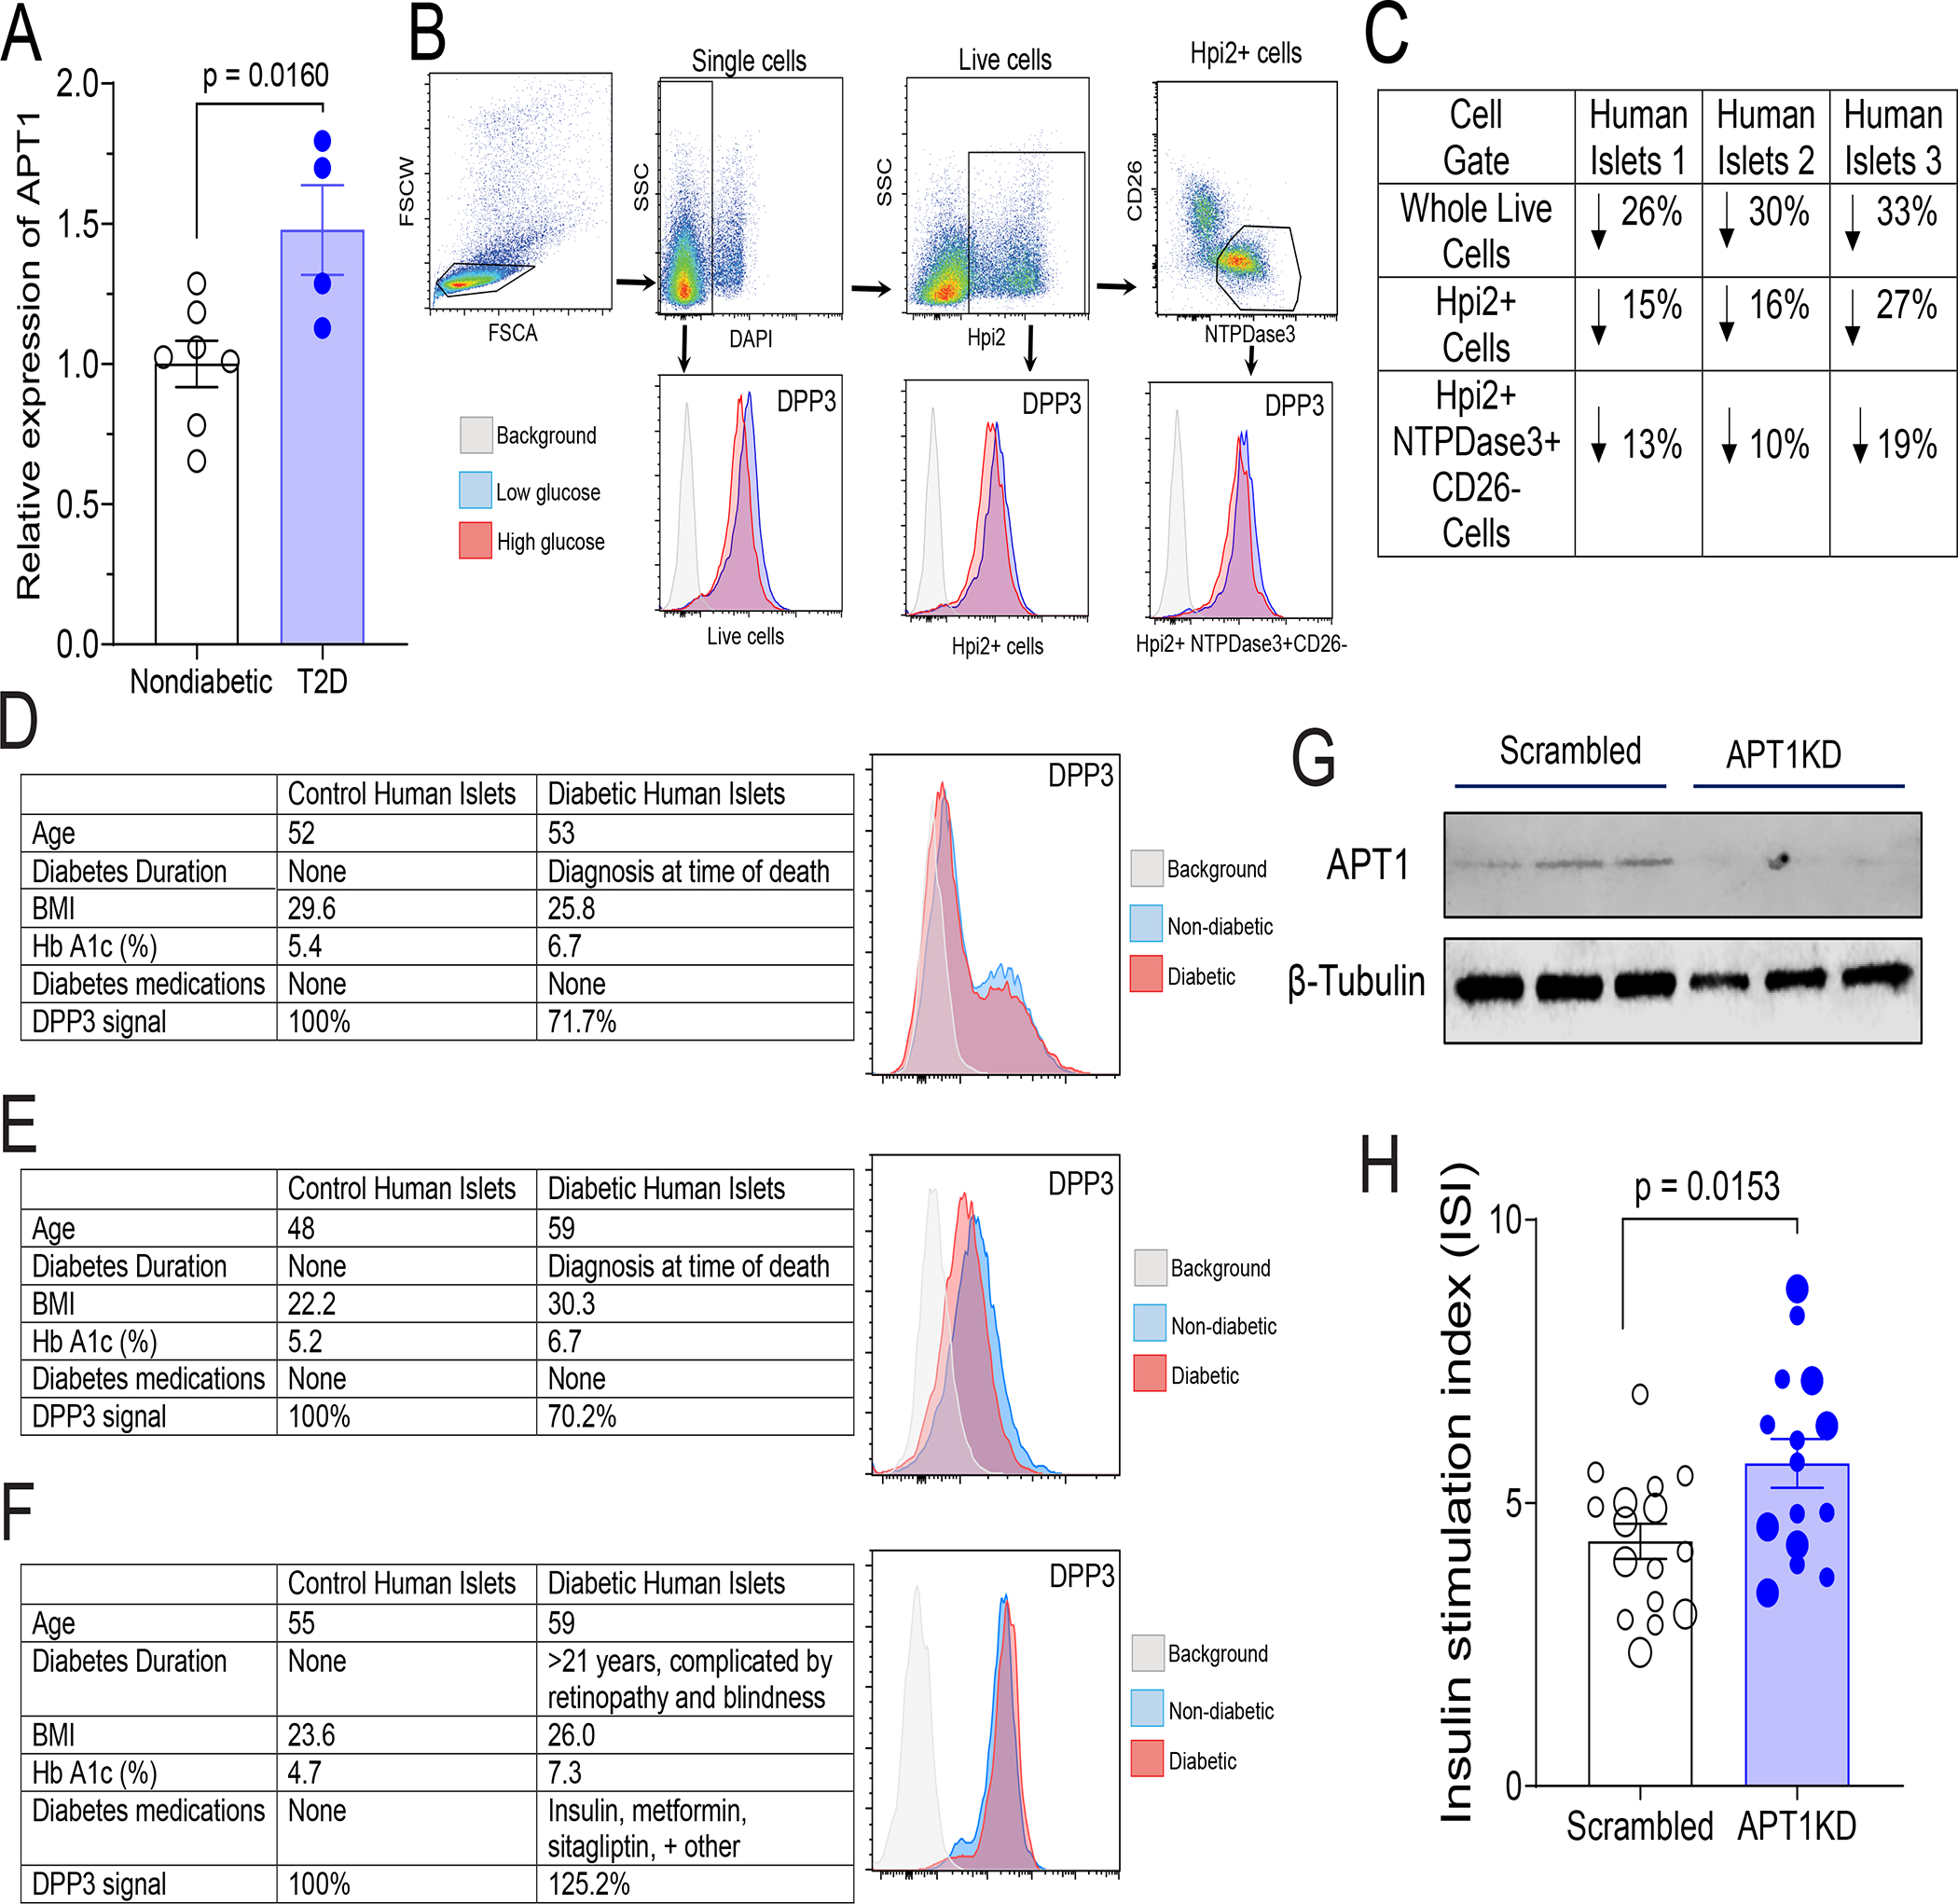
Figure 1. APT1 expression, enzyme activity, and effect of APT1 deficiency on insulin secretion in human islets.

(A) APT1 mRNA in islets from control (nondiabetic) and type 2 diabetes (T2D) humans. Donor demographics are provided in Table S1A. (B,C) Hyperglycemia decreases APT1 enzyme activity in nondiabetic human islets. APT1 activity was assayed using fluorescent depalmitoylation probe DPP3 in human islets treated with low glucose (5.5 mM) or high glucose (25 mM) for 48 h. FACS gating strategy is shown in top of panel B and the DPP3 histogram for each gate is shown in the bottom of panel B. Whole live cells: single+ DAPI−; Islet cells: single+DAPI−Hpi2+; β-cells: single+DAPI−Hpi2+CD26−NTPDase3+. Panel C shows the activity results for three independent assays using islets from three different donors. Donor demographics are provided in Table S1B. (D,E,F) Comparison of APT1 enzyme activity in human diabetic and nondiabetic islets. Panels D (donor IDs HP-20021-01, HP-20019-01T2D) and E (donor IDs HP-21124-01, HP-21129-01T2D) used islets from donors with no prior history of diabetes; Panel F (donor IDs HP-20268-01, HP-20259-01T2D) used islets from a donor with a long history of diabetes and its complications. (G,H) APT1 knockdown in nondiabetic human islets increases insulin secretion. Western blots to verify knockdown are shown for three culture aliquots in panel G. Insulin stimulation index (insulin after 16.7 mM glucose as compared to 3 mM glucose) in multiple aliquots of islets from two different normal donors indicated by different size symbols. Donor demographics are provided in Table S1C.
