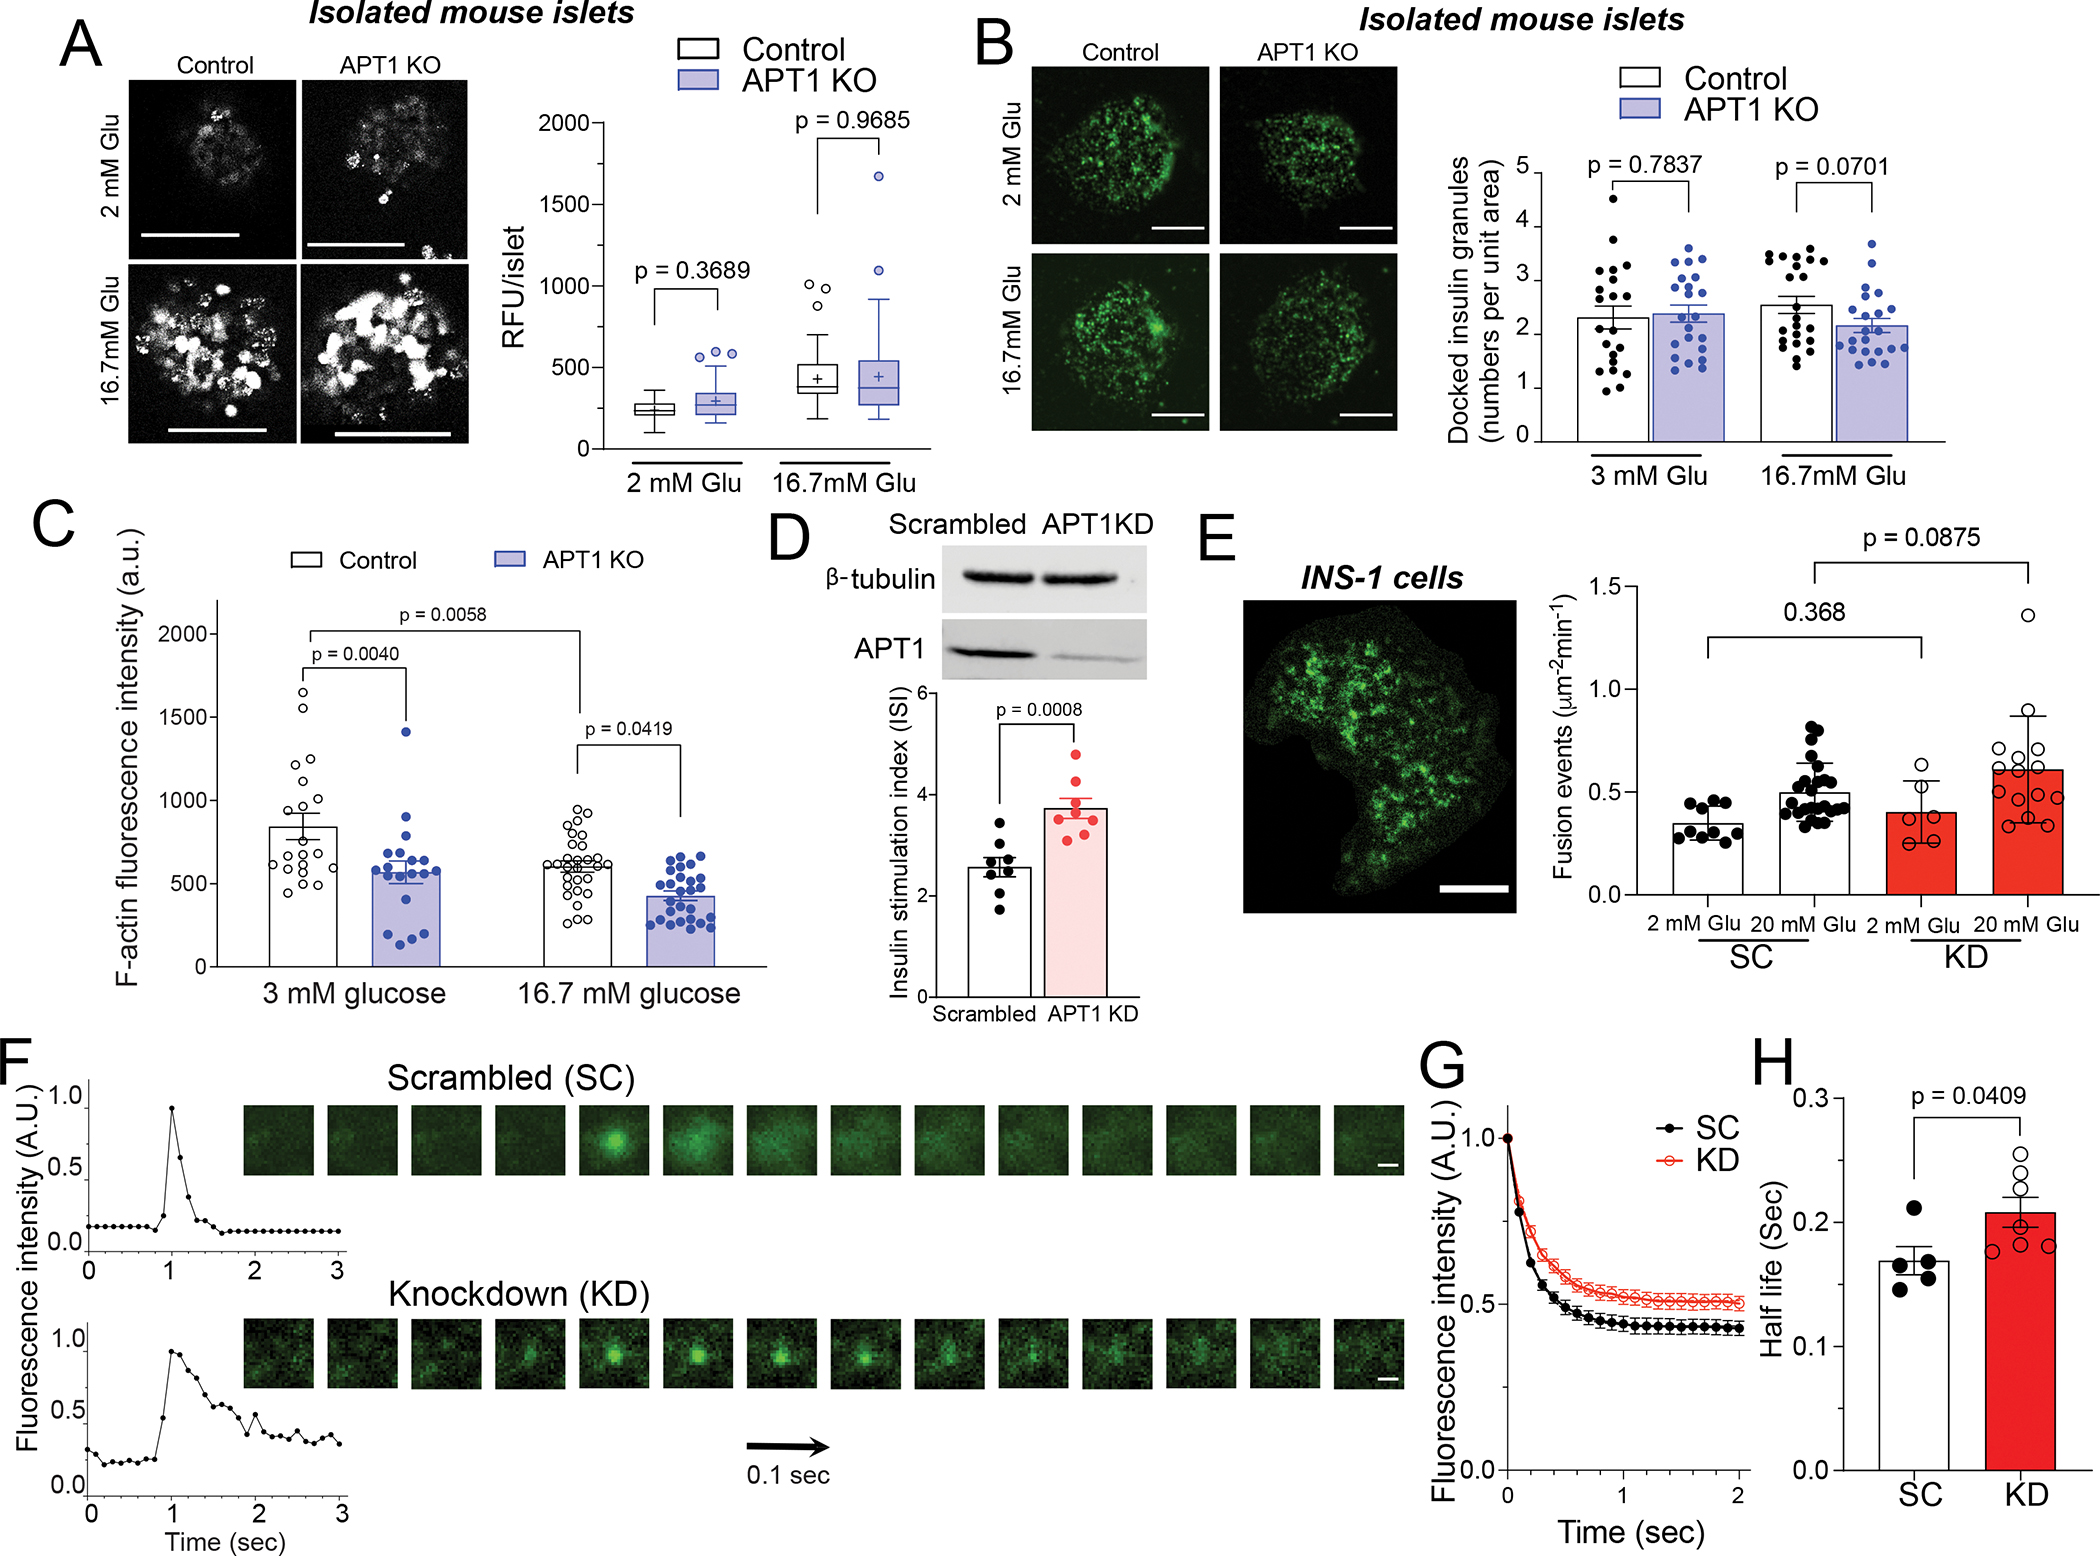
Figure 3. Calcium imaging, docked granules, cortical actin, and kinetics of granule fusion.

(A) Fluo-4 live cell imaging of isolated islets in the presence of 2 mM and 16.7 mM glucose. Scale=100 μm. (B) Docked insulin granule analysis by TIRF imaging in the presence of 3 mM and 16.7 mM glucose. Scale=5 μm. (C) Dispersed islets from global APT1 knockout and control mice were isolated and F-actin was imaged in cells incubated in 3 mM or 16.7 mM glucose. P values represent comparisons by two-way ANOVA. (D) Western blotting to validate the knockdown of APT1 in INS-1 832/13 cells (top panel) and increased glucose-stimulated insulin secretion in APT1 knockdown cells (bottom panel). (E) VAMP2-pHluorin imaging of insulin granules in an INS-1 cell by TIRF (left panel, Scale=5 μm) and fusion events in scrambled (SC) and APT1 knockdown (KD) INS-1 cells (right panel). (F) Intensity of isolated granule fusion events (left) and video frames of representative fusion events imaged by TIRF (right). Scale=0.5 μm. (G) Decay curve of peak intensity during fusion events for scrambled (SC) and APT1 knockdown (KD) cells. (H) Half-life of granule fusion for scrambled (SC) and APT1 knockdown (KD) cells.
