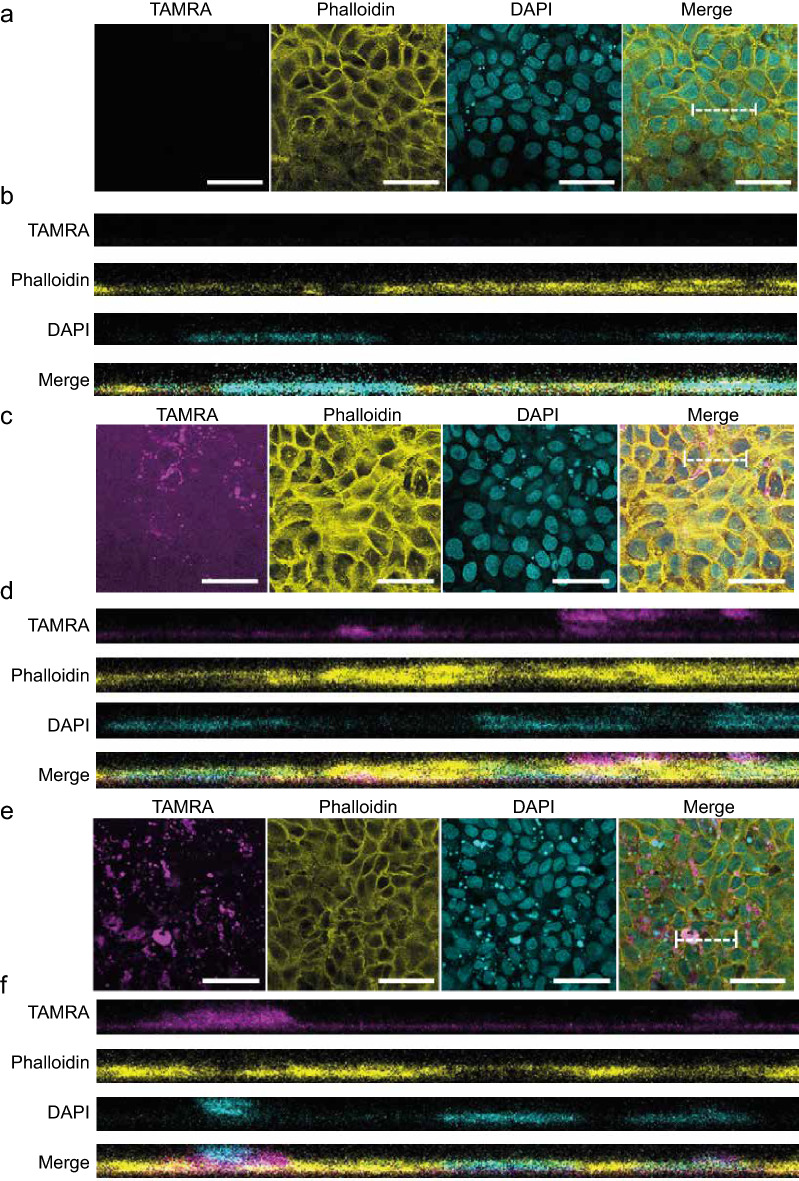
Figure 3.
Fluorescent HBD2 localization. HaCaT cells were seeded into ibidi 8-well chamberwell slides. After confluency was reached, cells were treated with vehicle control (a,b) or 0.5 μg/ml TAMRA-labelled synthetic HBD2 (c–f). Images were collected 48 h after addition of peptide. Cells were fixed in 4% PFA and stained with Alex488 phalloidin (shown as yellow) and Hoechst (shown as cyan) with TAMRA HBD2 (shown as magenta). Images taken with Leica SP8 confocal microscope at 20 × magnification, with z-stacks taken at 0.7 μm intervals. 5 images taken per condition per time point. Representative of n = 2 biological repeats. (a,c,e) Representative images of one quarter confocal fields of view. Scale bar represents 50 μm. Dotted white lines indicate areas represented in 3D renderings. (b,d,f) Representative images of 3D rendering, generated with LASX software.

