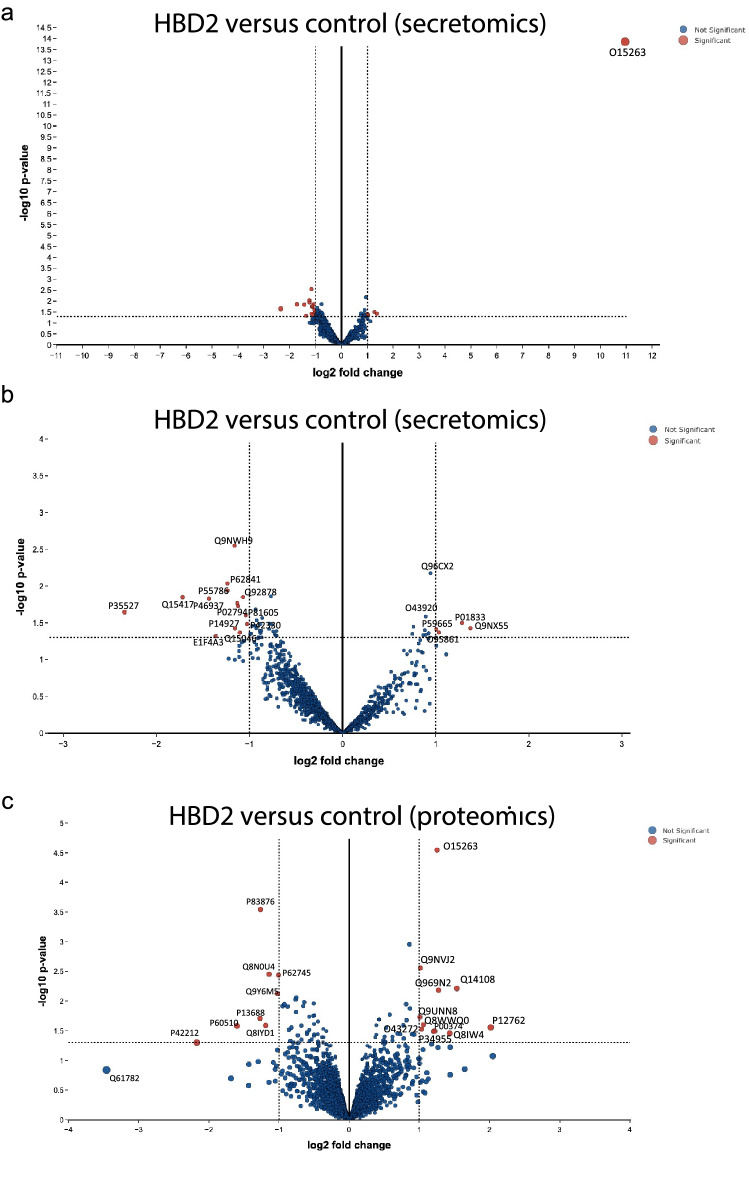
Figure 5.
Secretomic and proteomic analyses of HBD2-stimulated HaCaT cells. HaCaT cell monolayers were treated with 0.5 μg/ml HBD2, or vehicle control, in serum free media for 48 h before supernatants (a,b) and cells (c) were collected and centrifuged at 3000 rpm for 5 min. Media (a,b) and dry cell pellet (c) were stored at -80 °C prior to analysis. Data representative of n = 5. Log fold changes and p values generated using LIMMA pathway37. (a,b) Volcano plots generated from secretomics analysis of HBD2-stimulated HaCaT cells compared to control vehicle-treated cells. Red points indicate significant points, blue indicate nonsignificant points. (a) Data represented as a whole. (b) Data represented without O15263 data point, zoomed in to central portion of graph. (c) Volcano plot generated from proteomics analysis of HBD2-stimulated HaCaT cells compared to control vehicle-treated cells. Red points indicate significant points, blue indicate nonsignificant points.

