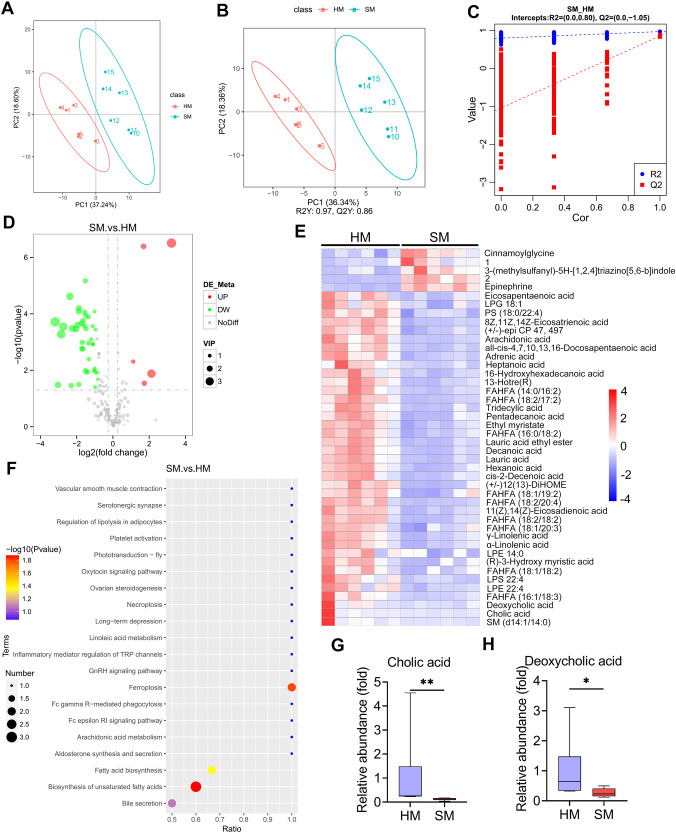
Fig. 1. The metabolic profiles of the milk samples from the healthy and SARA cows.
A PCA score plots for milk samples (n = 6). B PLS-DA score plots for the milk samples (n = 6). C Cross-validation plot with a permutation test repeated 200 times. The intercepts of R2 = (0.0, 0.80) and Q2 = (0.0,–1.05), indicate that the PLS-DA model is not overfitting. D Volcano plots indicate the results of the pairwise comparisons of metabolites in the healthy and SARA cows. The vertical and horizontal dashed lines indicate the threshold for the twofold abundance difference and the p = 0.05 threshold, respectively. Student’s t-test was performed for the comparison. The significant metabolites are presented in red (upregulated) or green (downregulated). E The hierarchical cluster analysis of the different milk metabolites between healthy and SARA cows. 1. 1-methyl-N-(3-methyl-5-cinnolinyl)-1H-imidazole-4-sulfonamide; 2. N-(1,1-Dioxotetrahydro-1H-1λ6-thiophen-3-yl)-4-methoxybenzamide. F The pathway enrichment analysis of significantly elevated metabolites in the SARA samples according to the KEGG pathway. The relative levels of cholic acid (G) and deoxycholic acid (H) in the healthy and SARA samples were determined. Data are presented as boxplots, with the center line representing the median, the boundary of the whiskers representing the minimum and maximum values of the dataset, and the boundary of the box representing the 25th and 75th percentile of the dataset (G and H). Mann-Whitney U test was performed (G, H). *p < 0.05, **p < 0.01. PLS-DA, partial least squares discrimination analysis; VIP, variable importance in the projection.

