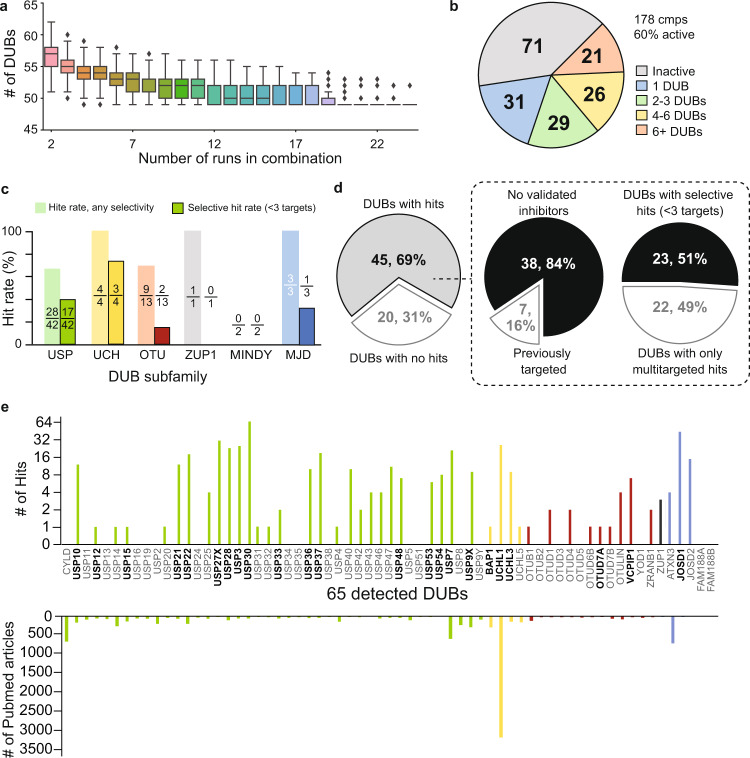
Fig. 2. DUB trends in primary screening.
a DUB ABPP assay performance The number of DUBs consistently detected across each unique combination of 2–24 assay runs (n = 25 biologically independent experiments) quickly stabilized to 49, with 56 DUBs detected in >80% of runs. Line at center of box shows median number of DUBs detected for the given number of assays considered, box encapsulates the middle two quartiles, while bars represent bounds for the rest of the distribution. “Outlier” points as calculated by an inter-quartile method are shown as diamonds. b Most compounds were active and spanned diverse selectivity profiles. c Hit rates were roughly consistent across the DUB subfamilies, with no hits identified for the MINDY subfamily. Insets above indicate number of DUBs targeted (numerator) with any selectivity (light color) or selectively with <3 targets (dark color) out of all DUBs in the subfamily (denominator). d left: Hits were successfully identified for 69% (45 out of 65) of the detected DUBs. Dashed box, left pie chart: 84% (38 out of 45) of hits did not have validated inhibitors reported. Dashed box, right pie chart: 51% (23 out of 45) of hits were targeted by selective compounds with <3 DUB targets. e DUBs targeted by library compounds. Individual DUBs showed a range of targetability by our library, within 1 to 65 library compounds hitting each targeted DUB, number of hits per DUB shown in the upper bar chart. Hit compounds were successfully identified against understudied members of the target class, including 11 DUBs with ≤ 20 publications, number of Pubmed articles for each DUB shown in lower bar chart. DUB from different subfamilies were grouped and shown in different colors: USP (green), UCH (yellow), OTU (maroon), ZUP1 (black), MJD (blue), MINDY (no hits, no colored bar). Selectively targeted DUBs are shown in bold.

