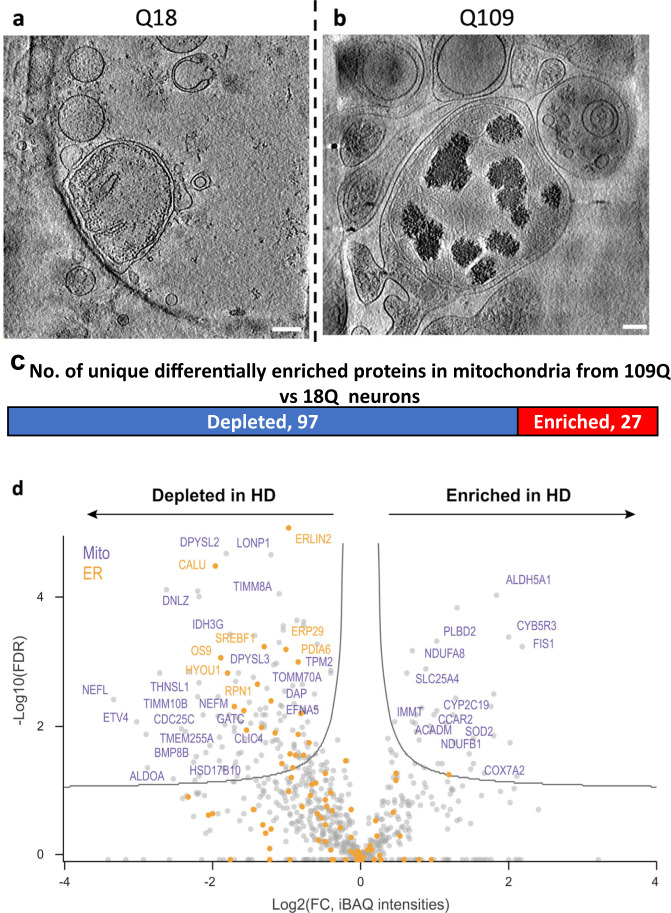
Fig. 6. Mass spectrometry of isolated mitochondria revealed different levels of associated proteins in neurites of iPSC-neurons (Q109) vs controls with representative cryoET of isolated HD mitochondria.
Z-slices (~1.4 nm thick) of a control Q18 and b Q109 mitochondria showing abnormal accumulation and enlargement of mitochondrial granules in the latter. Scale bar = 100 nm. Most of the mitochondria from Q109 have aberrant cristae and no granules as shown in Fig. 1 and quantitated in Fig. 9. c Mass spectrometry of proteins in isolated mitochondria showed 177 differentially enriched peptides, of which 124 were unique to a certain protein. d Scatter plot showing fold change of peptides(X) vs the log false discovery rate(Y) of the 177 peptides highlighting selected proteins that were depleted or increased in HD (Q109) mitochondria in comparison to controls (Q18). Mitochondrial proteins are colored in purple and ER proteins in orange.

