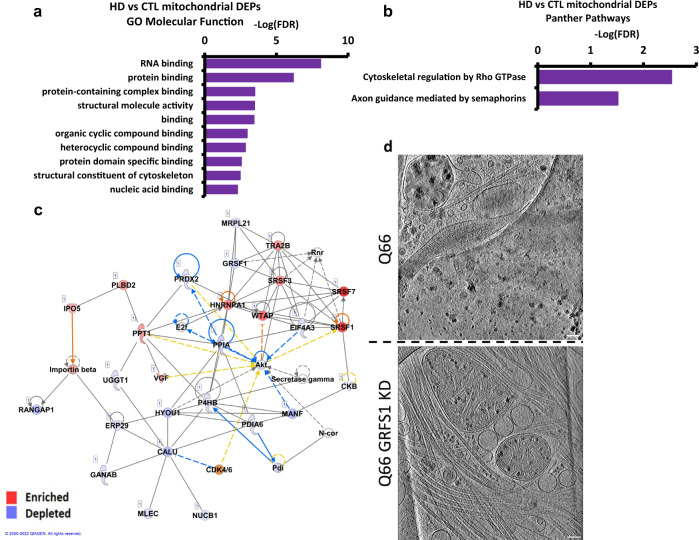
Fig. 7. Analysis of mass spectrometry data from isolated HD (Q109) vs control mitochondria indicates RNA binding and knockdown of RNA binding protein GRSF1 in Q66 reduces mitochondria granule size.
a Graph of gene ontology (GO) analysis of the 124 unique of differentially enriched proteins in HD vs control mitochondria showing molecular functions overrepresented by HD DEPs. The false Discovery Rate (FDR) indicates the reliability of the functional identification of the DEPs. b Graph of Panther analysis of the 124 differentially enriched proteins in HD vs control mitochondria showing Panther Pathways overrepresented by HD mitochondria differentially enriched proteins. c Ingenuity pathway analysis of the differentially enriched proteins between HD and control mitochondria highlighted Post-Translational Modification, RNA Post-Transcriptional Modification, and Protein Folding as the top network (score, 60 Focus molecules: 27). Proteins in blue are depleted in HD while proteins in red are enriched. d Examples of z-slices (~1.4 nm thick) through cryoET tomograms of day 37 iPSC-neurons (Q66) without (top) and with (bottom) treatment at day 28 with GRSF1 siRNA. Scale bars = 100 nm.

