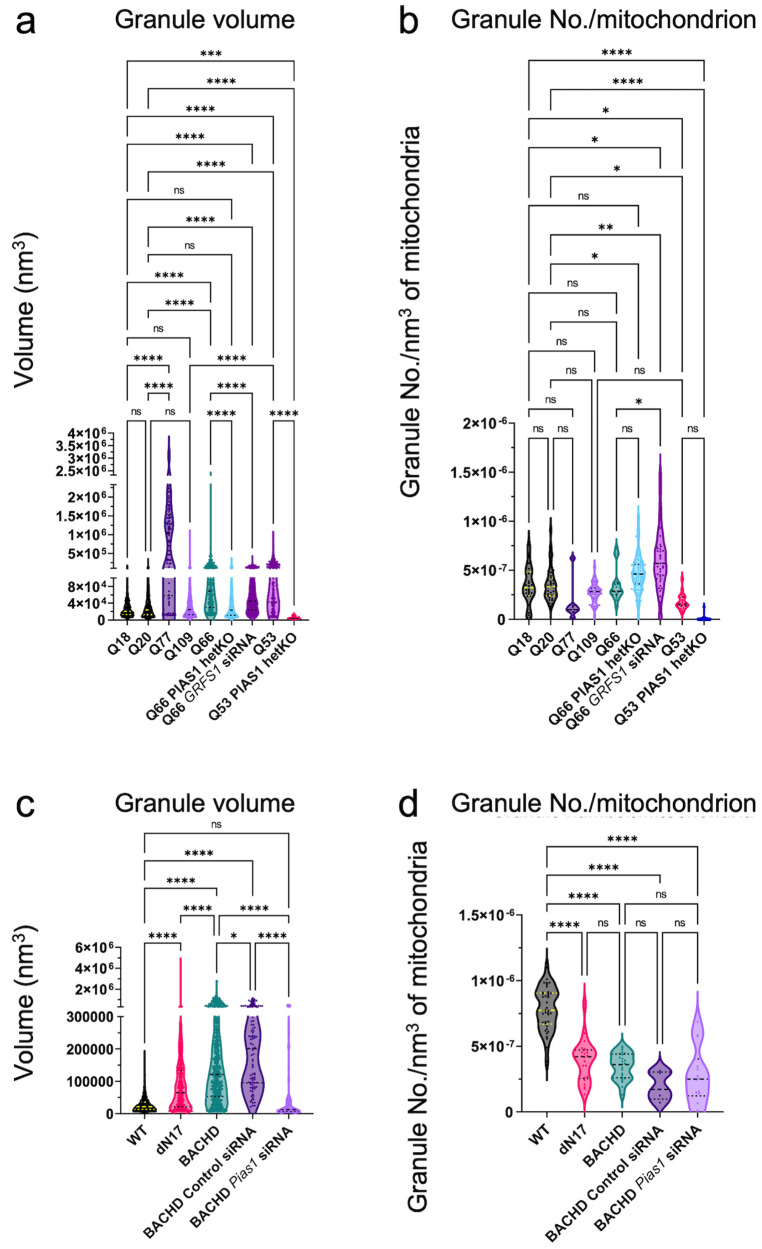
Fig. 9. Artificial Intelligence (AI)-based 3D quantification of mitochondrial granule volume and granule number per mitochondrial volume.
AI-based quantitation of neuronal tomograms containing mitochondria demonstrates a significant increase in mitochondrial granule size with higher polyQ in HD human and mouse model neurons. While this is rescued by PIAS1 hetKO and GRSF1 siRNA in iPSC neurons, it is only partially rescued by Pias1 KD in mouse model neurons. Violin plots displaying AI measurements of mitochondrial granule a volume (Kruskal Wallis statistic = 857.2, P value < 0.0001 with Dunn’s multiple comparisons) and b numbers per nm3 of mitochondrial volume (Kruskal Wallis statistic = 129.6 P < 0.0001 with Dunn’s multiple comparisons) from cryoET tomograms of neurites for several HD patient iPSC-neuronal cell lines (number of tomograms per cell line: Q18 = 21, Q20 = 20, Q53 = 14, Q66 = 10, Q77 = 5, Q109 = 37, Q53 PIAS1 hetKO = 22, Q66 PIAS1 hetKO = 68 and Q66 GRSF1 siRNA = 17; number of granules per cell line:Q18 = 364, Q20 = 774 Q53 = 254, Q66 = 249, Q77 = 94, Q109 = 1534, Q53 PIAS1 hetKO = 13, and Q66 PIAS1 hetKO = 2524 and Q66 GRSF1 siRNA = 958) as well as mitochondrial granule c volume (Kruskal Wallis statistic = 1030, P < 0.0001 with Dunn’s multiple comparisons) and d numbers per nm3 of mitochondrial volume (Kruskal Wallis statistic = 68.28, P < 0.0001 with Dunn’s multiple comparisons) from cryoET tomograms of neurites for three mouse neuron models (number of tomograms per mouse model: WT = 31, BACHD = 22, dN17 BACHD = 15, BACHD Control siRNA=5 and BACHD Pias1 siRNA=12; number of granules per mouse model:WT = 2057, BACHD = 634, dN17-BACHD = 477, BACHD Control siRNA = 91 and BACHD Pias1 siRNA = 92). The human neurons and mouse model neurons showed an increase in granule volumes in all but Q109, a trend of reduced granule number in human neurons and a significant reduction in granule number in mouse model neurons. Median displayed as dashed line, dotted lines display quartiles. ns = not significant, ****p < 0.0001, **p < 0.01, *p < 0.05 For full statistical details refer to Supplementary Table 2. Source data are provided as a Source Data file.

