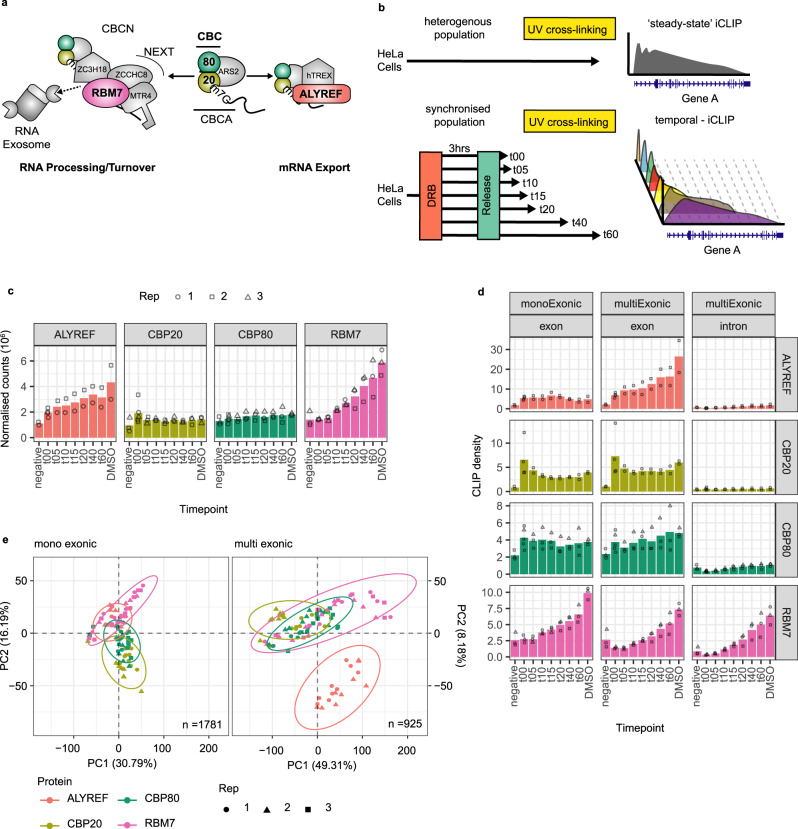
Fig. 1. Temporal-iCLIP uncovers dynamic RBP-RNA-binding profiles.
a Simplified overview of the CBC and its two cofactors, ALYREF and RBM7, with relevance for the present study. See text for further detail. b Schematic outline of the tiCLIP approach (lower panel) as compared to regular steady state iCLIP (upper panel). c Histograms showing the average number of normalised mapped tiCLIP reads. Numbers from individual biological replicates are shown as circles, squares and triangles. ‘Negative’ timepoints represent controls in which blank magnetic beads were used (negative anti-GFP lanes) on unsynchronised samples. d Histograms showing average RBP binding densities (reads/kb) calculated from all exonic and intronic regions of mono- and multi-exonic transcription units (TUs) as indicated. 22,650 TUs were used in this analysis. Biological replicates are shown as in c. e Principal component analysis (PCA) plot of tiCLIP data from mono (left)- and multi (right)-exonic TUs showing the variation across libraries. In order to capture the spatial variance, whole TUs were segmented into 10 kb bins and treated as individual data points. n = number of TUs used for analyses. Biological replicates are shown as in c. Source data are provided as a Source Data file.

