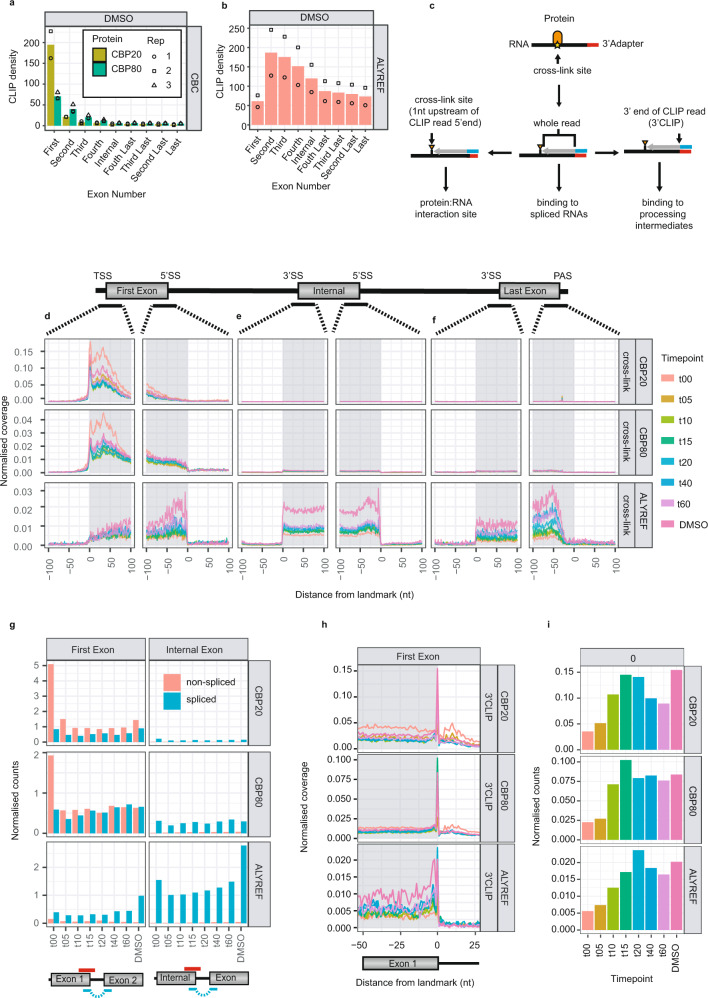
Fig. 3. ALYREF and the CBC bind specific RNA splicing intermediates.
a, b Histograms displaying the average ‘steady state’ CLIP (DMSO) binding densities for CBC (a) (CBP20 (yellow), CBP80 (green)) and ALYREF (b) across the first 4, the last 4 and any internal exons as indicated. Individual biological replicate samples are shown as circles, squares and triangles. 9998 TUs were used in this analysis. c Schematic representation of the CLIP read information displayed in coverage plots: cross-link sites (lower left), whole read (lower centre) or 3′end of CLIP read (3′CLIP) (lower right). Text indicates how the respective CLIP reads can be used to identify RBP binding to specific RNA species/intermediates. d–f Aggregate plots displaying the normalised coverage of cross-link sites across multi-exonic TUs for CBP20 (top), CBP80 (middle) or ALYREF (bottom), split into 201nt windows centred around the 5′- or 3′-ends of first (d), internal (e), or last exons (f). Shaded areas indicate exonic regions. Plots show the average signals from replicate samples. 11249 TUs were used in this analysis. g Normalised counts of non-spliced (red) vs. spliced (blue) reads, overlapping the last nucleotide within the first (left) or internal (right) exons. Below the histograms is a schematic representation of how non-spliced (red) vs. spliced (blue) reads, overlapping the ends of first or internal exons, were selected. Histograms display average counts from replicate samples. 3429 TUs were used in this analysis. h Aggregate plots displaying the normalised coverage of 3′CLIP data over a 76nt window centred around the 3′end of the 1st exon, for CBP20 (top), CBP80 (middle) and ALYREF (bottom). Shaded areas indicate exonic regions. 10752 TUs were used in this analysis. Timepoint colour code as in d–f. i Histograms quantifying the 3′CLIP signal present at the 3′ends of 1st exons (‘0’) in h. Average of biological replicates is shown. 4915 TUs were used in this analysis. Source data are provided as a Source Data file.

