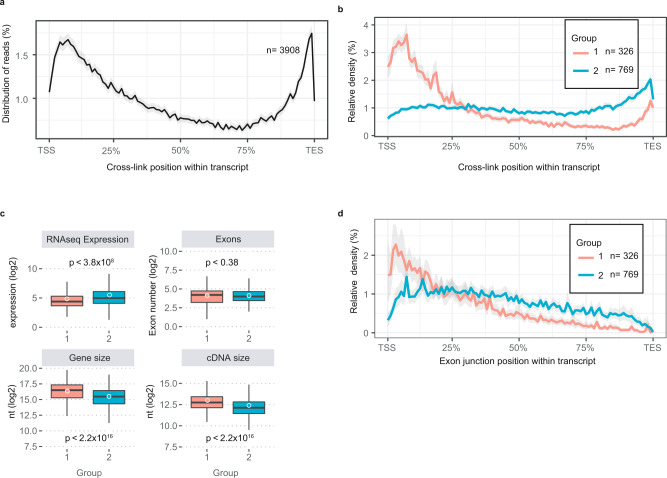
Fig. 4. Transcript features dictate different ALYREF anchoring profiles.
a Average distribution plot of ALYREF cross-link sites across all TU’s. TU’s were normalised for length and expressing transcripts above 200nt. Data represent the average of two biological replicates, with confidence intervals shown as a grey ribbon. The number of TUs used for profiling is indicated. b As in a but stratified by gene groups identified by k-means clustering analysis (Supplementary Fig. 4a). c Boxplots indicating the median (middle line), first and third quartiles (box), ±1.5 × interquartile range (whiskers) and the sample mean (white circle) of RNAseq expression values, total exons, gene size and cDNA size of the two gene groups from b. Shown values were log2 transformed. A two-sided Wilcox rank sum test was used to compare the means. No adjustments were made for multiple comparisons. p values are shown on respective panels. Group 1 n = 326 genes assessed over two biological replicates; Group 2 n = 769 genes assessed over 2 biological replicates. d As in b but plotting the average internal exon-junction densities across group 1 or 2 TUs. Source data are provided as a Source Data file.

