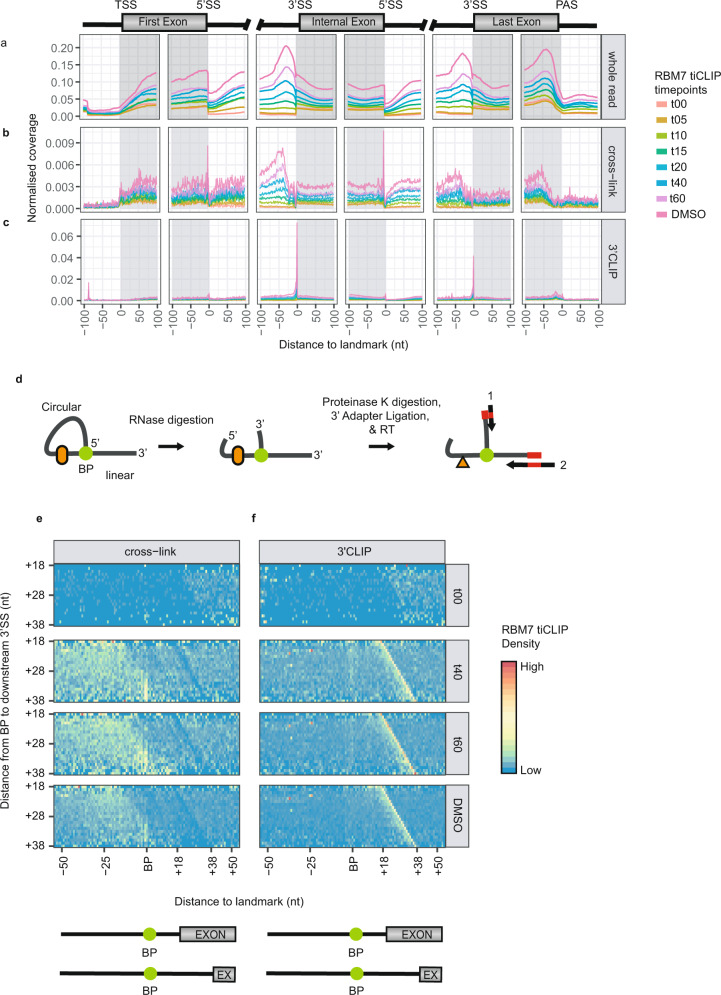
Fig. 5. RBM7 is recruited to introns before debranching but after the second transesterification step.
a–c Normalised RBM7 coverage profiles as in Fig. 3d, e, but across multi-exonic TUs and displaying the whole read (a), the cross-link site (b) or the 3′CLIP site (c). 11249 TUs were used in this analysis. d A schematic representation of the two possible cDNA truncation sites upon reverse transcription of a cleaved lariat intron. RT primer ‘1’ indicates cDNA synthesis from within the lariat, whereas RT primer ‘2’ indicates cDNA synthesis from the linear part of the lariat. Cross-linked protein is represented by orange cartouche, whereas the orange triangle represents a short peptide cross-linked to the RNA that remains after Proteinase K treatment. Green dots represent branchpoints (BP). e, f Heatmaps displaying RBM7 cross-linking (e) and 3′CLIP (f) sites centred around a 101nt window covering intron BPs, which were stratified by their ascending distance (18–38 nt) to the downstream 3′splice sites (3′SSs) and in vertical panels by their timepoints shown to the right. Schematic of BP to 3′SSs distance displayed below heatmaps. Timepoint or sample shown to right of heatmap. 20811 BPs were analysed. Source data are provided as a Source Data file.

