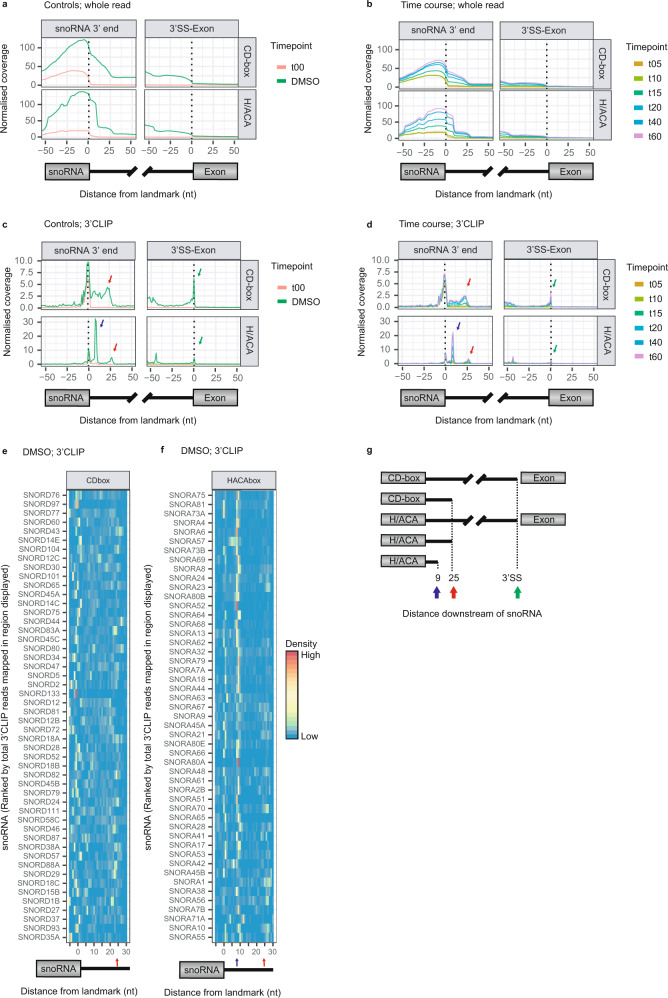
Fig. 6. RBM7 binds specific snoRNA intermediates.
a, b Whole tiCLIP read coverage of RBM7 plotted around a 101nt window centred on snoRNA 3′ends (left panel) or their downstream 3′SS (right panel). Profiles were stratified by CD- and H/ACA-box snoRNA classes as indicated. DMSO and t00 samples are shown in a, while all timepoints are shown in b. c, d as in a, b but plotting 3′CLIP data. Coloured arrows indicate common 3′CLIP data peaks. Blue colour is unique for H/ACA snoRNAs at 9nt. a–d 487 snoRNAs were used in this analysis. e, f Heatmaps depicting 3′CLIP signals downstream of CD-box (e) or H/ACA-box (f) snoRNAs. The 50 snoRNAs with the most cumulative total 3′CLIP signal present in the displayed 35nt window are shown. Coloured arrows as in c, d. g Schematic representation of 3′extended snoRNAs bound by RBM7. Arrows denote 3′extended snoRNAs as also shown in c–f. Source data are provided as Source Data file.

