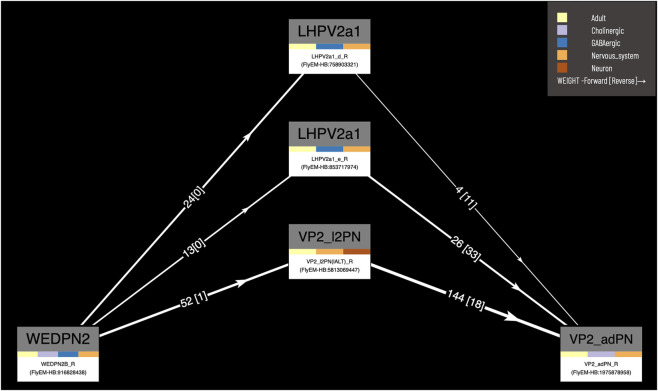
FIGURE 8.
Circuit browser. A circuit diagram of paths between “WEDPN2B_R” and “VP2_adPN_R”. Rectangles represent neurons with the symbols of classes at the top, names of individual neurons at the bottom and colors corresponding to gross classifications in the middle. The legend for these gross classifications can be seen in the top-right [note the WDPN2 is classed as both cholinergic and glutamatergic based on antibody staining evidence (Dolan et al., 2019)]. Pathways are ordered from “strongest” at the bottom to “weakest” at the top. Arrows show the direction of synaptic connectivity and numbers outside of brackets show the number of synapses annotated for each connection. Numbers inside brackets show the number of synapses in the opposite direction.

