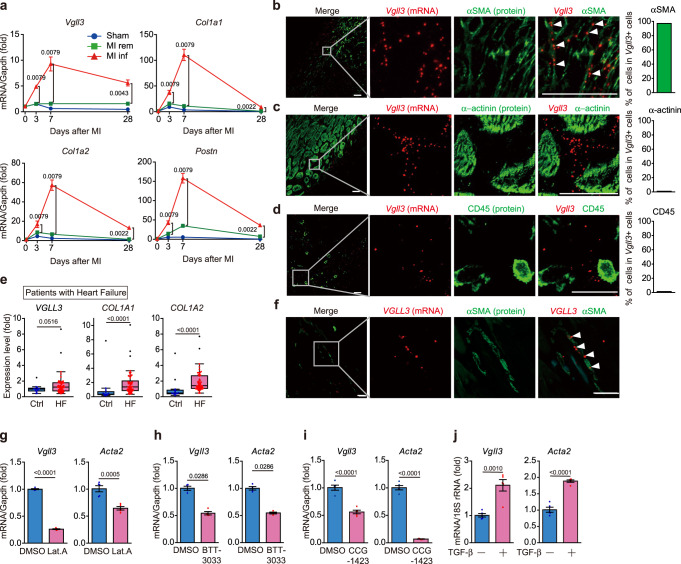
Fig. 2. Vgll3 is induced in fibrotic heart and is specifically expressed in myofibroblasts.
a mRNA levels of Vgll3 and fibrosis-related genes in sham-operated mouse hearts (sham), and in the remote (rem) and infarcted (inf) areas of mouse hearts after myocardial infarction (MI) (n = 3–6 hearts/group). b–d Co-detection of Vgll3 mRNA and αSMA (b), α-actinin (c) and CD45 (d) in the left ventricle of MI murine hearts on day 7. Percentage of cells positive for each marker protein in Vgll3 + cells is shown in each graph (n > 100 cells). e mRNA levels of VGLL3 and fibrosis-related genes in the hearts of control individuals (Ctrl) (n = 14) and patients with heart failure (HF) (n = 50) based on data from GSE116250. f Co-detection of VGLL3 mRNA and αSMA in the left ventricle of patients with MI. g–i Vgll3 and Acta2 mRNA levels in cardiac myofibroblasts treated with Lat.A (2 μM) for 4 h (n = 5 each) (g), BTT-3033 (15 μM) for 12 h (n = 4 each) (h) and CCG-1423 (10 μM) for 24 h (n = 5 each) (i). j Vgll3 and Acta2 mRNA levels in neonatal rat cardiac fibroblasts treated with TGF-β (10 ng/mL) for 24 h (n = 4 each). Data in (e) are presented as box and whisker plots (Tukey style, outliers in black dots). The box shows the 25th to 75th percentile range with the median value represented by a horizontal line. The whiskers stretch to the minimum and maximum values within 1.5 times the interquartile range from the 25th–75th percentiles. Data in (a), and (g–j) are presented as the mean ± SEM. P-values were determined using the two-sided Mann–Whitney’s U test in (a, e, h), two-sided Student’s t test in (g, i, j). All in situ hybridisation data are representative of at least three independent experiments. White arrowheads in (b, f) indicate the representative signals for Vgll3 or VGLL3 mRNA. Scale bars in b–d, f = 30 μm. Source data are provided as a Source Data file.

