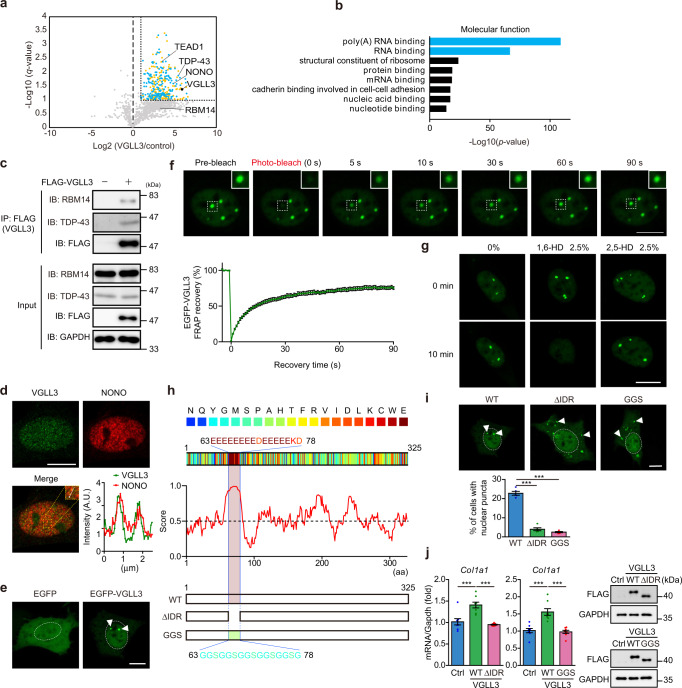
Fig. 4. VGLL3 undergoes liquid–liquid phase separation through its glutamic acid-rich low-complexity domain.
a Volcano plot of differential protein profiles in anti-FLAG immunoprecipitates from control and FLAG-VGLL3–overexpressing myofibroblasts. Orange and blue dots represent the proteins (q < 0.1, fold increase >2). Blue dots represent poly-(A) RNA binding and RNA binding proteins. b Enrichment analysis of the ontology for proteins that significantly interact with FLAG-VGLL3. c Interaction between FLAG-VGLL3 and endogenous RBM14 and TDP-43 in cardiac myofibroblasts. d Immunostaining of endogenous VGLL3 and NONO in myofibroblasts. The graph represents line scans along the white line in the yellow dashed square in the inset. e Images of live NIH3T3 cells overexpressing EGFP or EGFP-VGLL3. f Fluorescence recovery after photobleaching (FRAP) analysis of EGFP-VGLL3 puncta in live NIH3T3 cells. The mean intensity of normalised fluorescence was shown in the graph (n = 15). g Effects of 1,6-HD and 2,5-HD treatments on EGFP-VGLL3 puncta in NIH3T3 cells. h Scheme of the primary sequence of mouse VGLL3, with individual amino acids colour-coded by the PLAAC algorithm. Schematic prediction of intrinsic disorder tendency in mouse VGLL3 by IUPred2A. The intrinsically disordered region (IDR; aa 63–78) in mouse VGLL3 is highlighted. All amino acid residues in the IDR region were deleted (ΔIDR) or replaced with glycine (G) and serine (S) residues (GGS) in VGLL3 ΔIDR mutant or GGS mutant, respectively. i Images of live NIH3T3 cells overexpressing EGFP-VGLL3 (WT) and EGFP-VGLL3 mutants (ΔIDR and GGS). The graph represents the percentage of cells harbouring nuclear puncta in the cells (n = 5). j Col1a1 mRNA levels in the cells (n = 8). The protein levels of overexpressed FLAG-VGLL3s in the cells were evaluated by western blotting. All experiments were performed at least three times. Data in (i, j) are shown as the mean ± SEM. P-values were determined using one-way ANOVA followed by Tukey’s range test in (i, j), ***P < 0.001. White dashed circles or white arrowheads in (e, i) mark the nucleus or the representative puncta, respectively. Scale bars = 10 μm. Source data are provided as a Source Data file.

