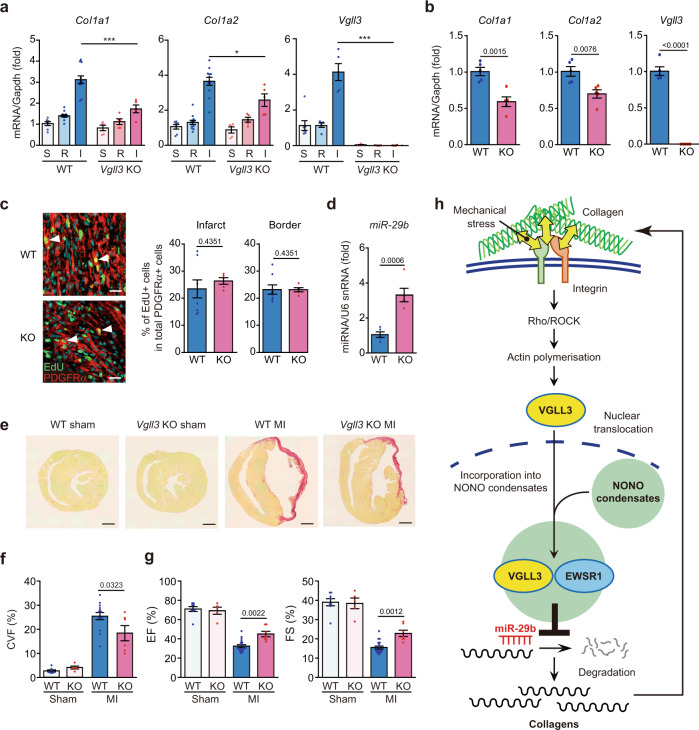
Fig. 6. Vgll3 deficiency in mice attenuates cardiac fibrosis and impairs cardiac dysfunctions after myocardial infarction.
a mRNA levels of Col1a1, Col1a2 and Vgll3 in sham (S)-operated ventricles, and in the remote (R) and infarcted (I) areas of wild-type (WT) and Vgll3 knock-out (KO) mouse hearts, 3 days after MI (WT: S/R/I, n = 7/12/12; KO: S/R/I, n = 5/5/5). b mRNA levels of Col1a1, Col1a2 and Vgll3 in cardiac myofibroblasts isolated from WT and Vgll3 KO mouse hearts, 3 days after MI (WT: n = 5; KO: n = 5). c Immunostaining images of heart sections of WT and Vgll3 KO mice on day 4 after MI. EdU were injected into the mice 24 h before sampling. White arrowheads indicate EdU+ and PDGFRα + fibroblasts. The percentages of EdU+ cells in total PDGFRα + fibroblasts of border or infarcted area are shown in the graph (WT: n = 8; KO: n = 5). d miR-29b levels in infarcted areas of WT and Vgll3 KO mouse hearts, 3 days after MI (n = 5 each). e Images of heart sections of WT and Vgll3 KO mice, 28 days after MI, stained with Picro-Sirius red. f The collagen volume fraction (CVF) was calculated as the percentage of Picro-Sirius red-positive collagen deposition area (WT: Sham/MI, n = 8/14; KO: Sham/MI, n = 5/6). g Echocardiographic measurements of the ejection fraction (EF) and fractional shortening (FS), 28 days after MI (WT: Sham/MI, n = 8/18; KO: Sham/MI, n = 5/7). h Schematic of the VGLL3-mediated signalling pathway that enhances collagen gene expression in myofibroblasts. Data in (a–d, f, g) are shown as the mean ± SEM. P-values were determined using one-way ANOVA followed by Tukey’s range test in (a) (Col1a1 and Col1a2), Kruskal–Wallis followed by Dunn’s test in (a) (Vgll3), two-sided Student’s t test in (b, d, f), and two-sided Mann–Whitney’s U test in (c, g), *P < 0.05, ***P < 0.001. n.s.; not statistically significant. Scale bars in c = 20 μm, e = 1 mm. Source data are provided as a Source Data file.

