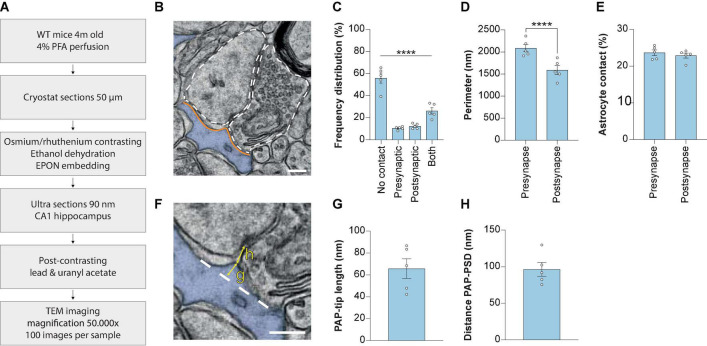
FIGURE 1.
Measuring synaptic ultrastructure and astrocyte interactions by 2D EM analysis in mouse hippocampus CA1. (A) Schematic illustration of the methods used. (B) Example 2D EM image of a synapse in mouse hippocampus CA1. The outline of the pre-synaptic and post-synaptic membranes is indicated with a dashed line. The astrocyte is pseudo-colored in blue. Orange lines indicate the membrane interaction between pre-synapse and post-synapse with the astrocyte. (C) Frequency distribution plot showing the percentages of presence of contact types between synapse and astrocyte. (D) Perimeter of the pre-synapse and post-synapse. (E) Contact between astrocyte and pre-synapse or post-synapse, relative to the pre-synapse or post-synapse perimeter, respectively. (F) Example of measurement of PAP tip length (G) and distance between the PAP-tip and PSD (H). The base of the protruding part of the PAP-tip is indicated with the dashed line. (G) Quantification of the PAP-tip to PSD distance. (H) Quantification of the astrocyte PAP tip length. Data is presented as mean SEM. ***P≤ 0.0001. PAP, perisynaptic astrocytic process; PSD, post-synaptic density. Scale bars are 300 nm n = 5/441. Statistical details are reported in Supplementary Table 1.

