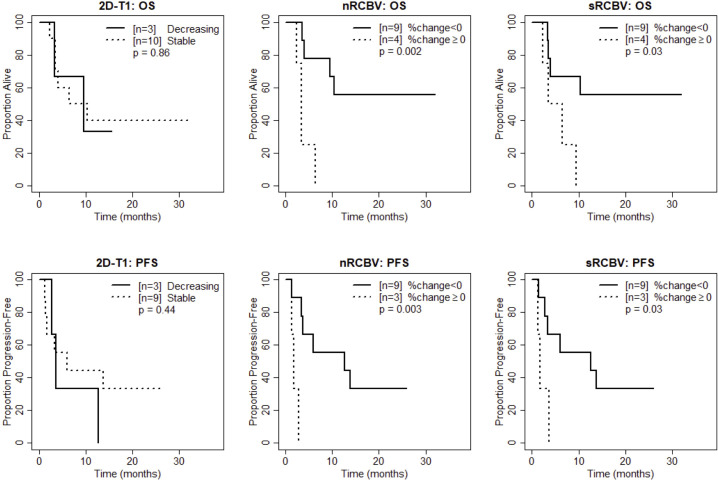
Figure 2.
Kaplan-Meier curves using week 2 DSC-MRI for time to death (top row) and time to progression or death (bottom row) for T1 non-progressors with stable versus decreasing enhancement on 2D-T1 (left column), T1 non-progressors with decreasing versus increasing normalized rCBV (nRCBV) (middle column), and T1 non-progressors with decreasing versus increasing standardized rCBV (sRCBV) (right column).

