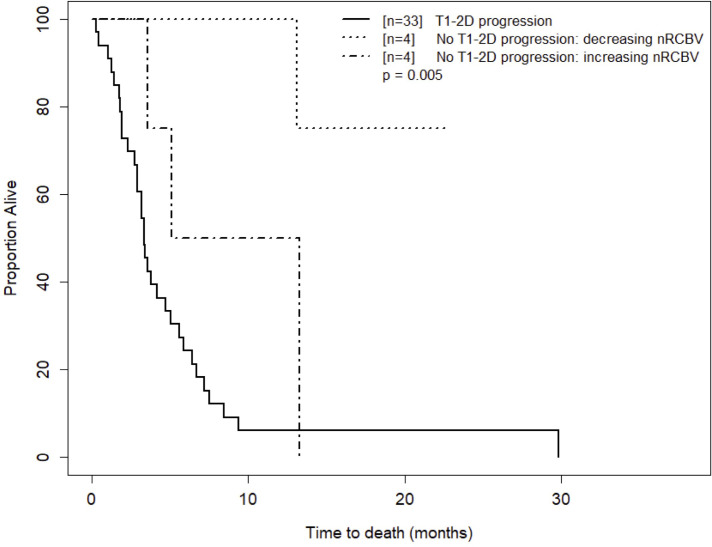
Figure 5.
Kaplan-Meier curves for time to death for T1 progressors and T1 non-progressors with increasing versus decreasing nRCBV at week 16. Visual separation of the curves potentiates 3-tier survival stratification, and an interpretation paradigm for recurrent GBM shortly after Bevacizumab whereby patients with progressive enhancement are deemed treatment failures, and change in rCBV further distinguishes relative successes from failures.

