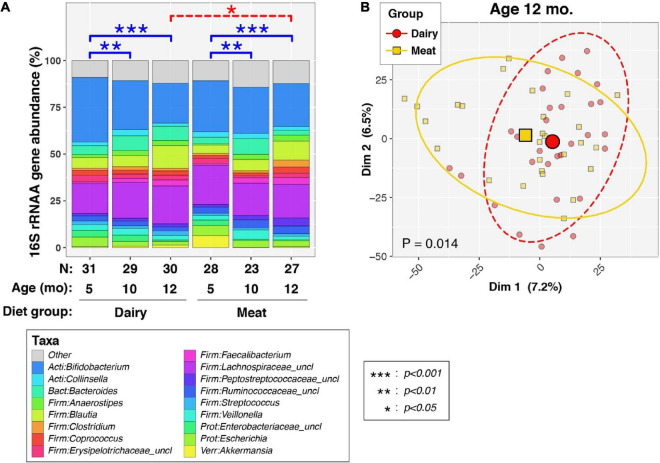
FIGURE 1.
Effects of diet and age on overall composition of infant fecal microbiota. (A) Barcharts show average percent relative abundances (%RA) of predominant taxa, stratified by age and dietary group. Taxa with %RA less than 2% were collapsed into the “Other” category to simplify the figure. Differences in bacterial profiles (beta-diversity) between ages and diet groups were assessed by weighted permutational ANOVA (PERMANOVA) tests, which applied the Aitchison dissimilarity index to sequence count data as a measure of beta-diversity. P-values were calculated through 106 label permutations. Solid blue brackets and asterisks (see box insert) denote p-values for within-group, longitudinal PERMANOVA tests between ages, which included subject IDs as covariates. Dashed red brackets and asterisks (see box insert) denote p-values for denote cross-sectional PERMANOVA tests of diet groups at each age. (B) Principal coordinates analysis (PCoA using Aitchison dissimilarity scores) of infants at 12 mo. of age. Small symbols represent individual subjects. Large symbols represent group means of PCoA scores along the first and second axis. Ellipses mark 95% confidence intervals. A PERMANOVA test indicated significant between-group differences in beta-diversity (P = 0.014), as also indicated in (A).

