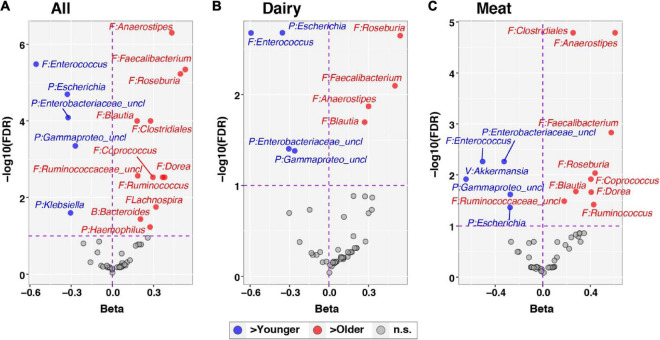
FIGURE 4.
Differential abundance of individual taxa across age. The development of individual taxa with age was evaluated through linear mixed effects modeling, as described in the text. Centered log-ratio transformed sequence count data for taxa were included in models as outcome variables. The panels show results for all subjects, adjusting for Diet group (A) and stratified by Dairy (B) and Meat (C) groups. Each panel plots regression beta coefficients (x-axis) vs. –log10 transformed, FDR-corrected p-values. Taxa significantly positively correlated with age (FDR < 0.1) have positive beta coefficients and are plotted to the right in red; conversely, taxa negatively correlated with age (FDR < 0.1) have negative beta coefficients and are plotted to the left in blue. Non-significant taxa (FDR > 0.1) are shown in gray. Taxa names are preceded by abbreviated phylum names: B, Bacteroidetes; F, Firmicutes; P, Proteobacteria; V, Verrucomicrobia.

