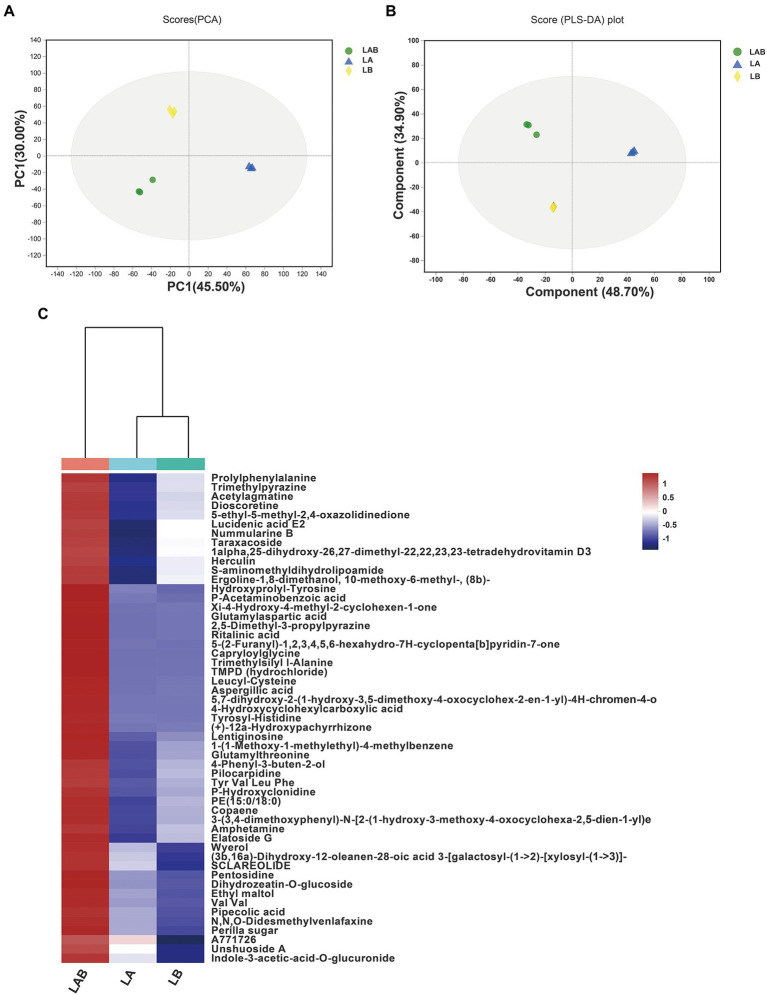
Figure 2.
Principal components analysis (PCA) score plots of extracellular metabolites (A). Partial least squares discriminant analysis (PLS-DA) score plots of extracellular metabolites (B). Hierarchical clustering analysis (HCA) of the 59 extracellular metabolites only overexpressed in co-culture group and represented on a heatmap (C). (LA, extracellular metabolites of E. amstelodami pure culture; LB, extracellular metabolites of B. licheniformis pure culture; LAB, extracellular metabolites of co-culture).

