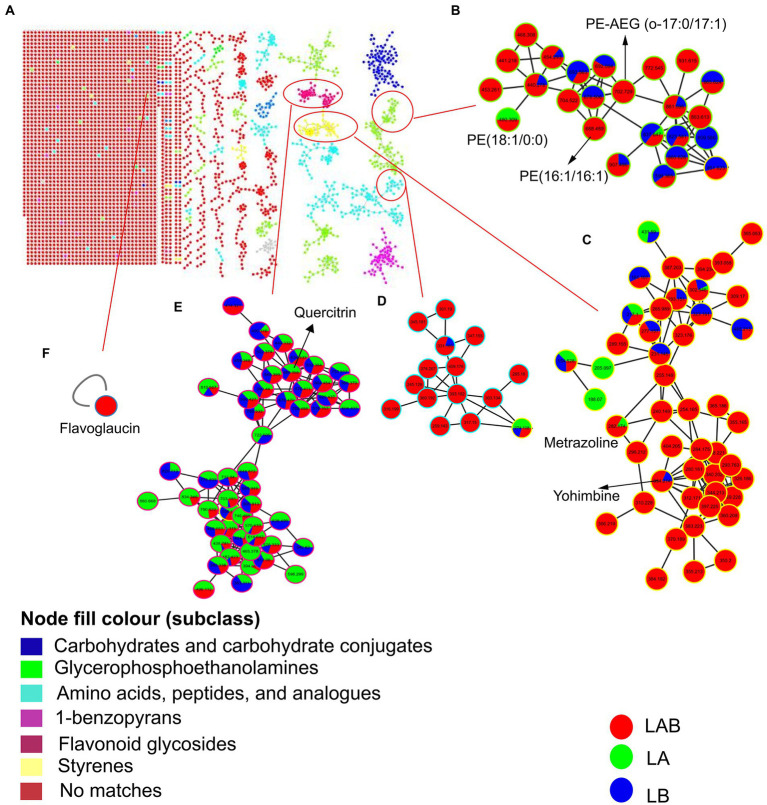
Figure 5.
Molecular network of the MS/MS spectra for extracellular extracts of E. amstelodami, B. licheniformis pure culture and co-cultures in positive ion mode (A). Chemical classification was achieved by MolNetEnhancer at the subclass level, (B–E) shows clusters of glycerophosphoethanolamines, styrenes, amino acids, peptides, and analogs and flavonoid glycosides, respectively. (F) Shows a putative flavoglaucin. Nodes represent parent ions and edge thickness corresponds to the cosine score, which represents the degree of similarity between the connected nodes. Pie ratio was determined according to scan number of spectra.

