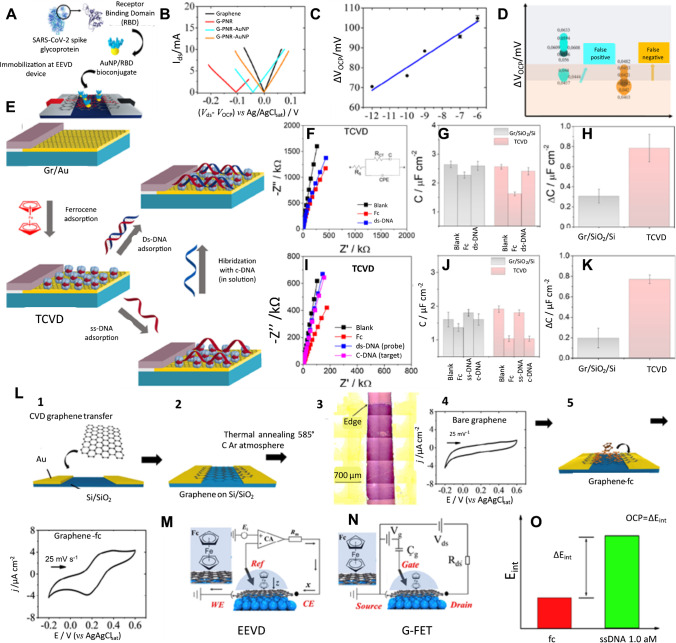
Fig. 4.
Graphene-based bioelectronics. (A) Schematic representation of the method for immobilizing AuNP/RBD onto G-PNR. (B) Hybrid Ids vs. Vds EE curves for bare graphene (black), G-PNR (red), G-PNR-AuNP/RBD (cyan), and G-PNR-AuNP/RBD after interactions with human IgG (orange) in PBS buffer. (C) Calibration curve for IgG detections from 1.0 pg mL−1 to 1.0 μg mL−1 in PBS as support electrolyte by hybrid Ids vs. Vds EE experiments. (D) Distribution of OCP displacement values positive and negative IgG detections in diluted patient serum samples by G-PNRAuNP/RBD EEVD. Reproduced from [5], with permission from Elsevier. Monolayer graphene-based three-component vertically designed (TCVD) device. (E) Schematic illustration of the detection of ds-DNA adsorption and hybridization in solution using the TCVD device. (F) Nyquist plots obtained during the adsorption of Fc and ds-DNA onto the device surface. (G) Plot of the measured capacitance of the TCVD and Gr/SiO2/Si electrode fitting the Nyquist plots to the equivalent circuit (inset of F). (H) Plot of the change in the capacitance after the adsorption of ds-DNA to the electrode surface. (I) Nyquist plots of the TCVD electrode obtained during the adsorption of Fc, ss-DNA, and complementary DNA to the electrode surface. (J) Plot of the measured capacitance of the TCVD and Gr/SiO2/Si electrode obtained from fitting the Nyquist plots to the equivalent circuit (inset of J). (K) Plot of change in the capacitance after the hybridization of the DNA on the electrode surface from the solution. Reproduced from [117], with permission from Elsevier. (L) Electrical–electrochemical vertical device (EEVD) device preparation description. Steps 1 and 2 correspond to graphene wet transfer methodology. Step 3 presents an optical micrograph of graphene on SiO2/Si. Step 4 depicts an electrochemical response of typical pristine graphene. Step 5 illustrates ferrocene in ethanol drop casting and its adsorption onto graphene, forming a graphene-fc vdW heterojunction. Step 6 illustrates a typical final cyclic voltammogram obtained for graphene-fc in phosphate buffer solution. (M) Schematic representation of the working principles of an EEVD with the proposed graphene-fc heterojunction. (N) Schematic representation of a GFET’s working principles for comparison with M. (O) Representation of ss-DNA quantification using EEVD graphene-fc devices. Reproduced from [113], with permission from Elsevier

