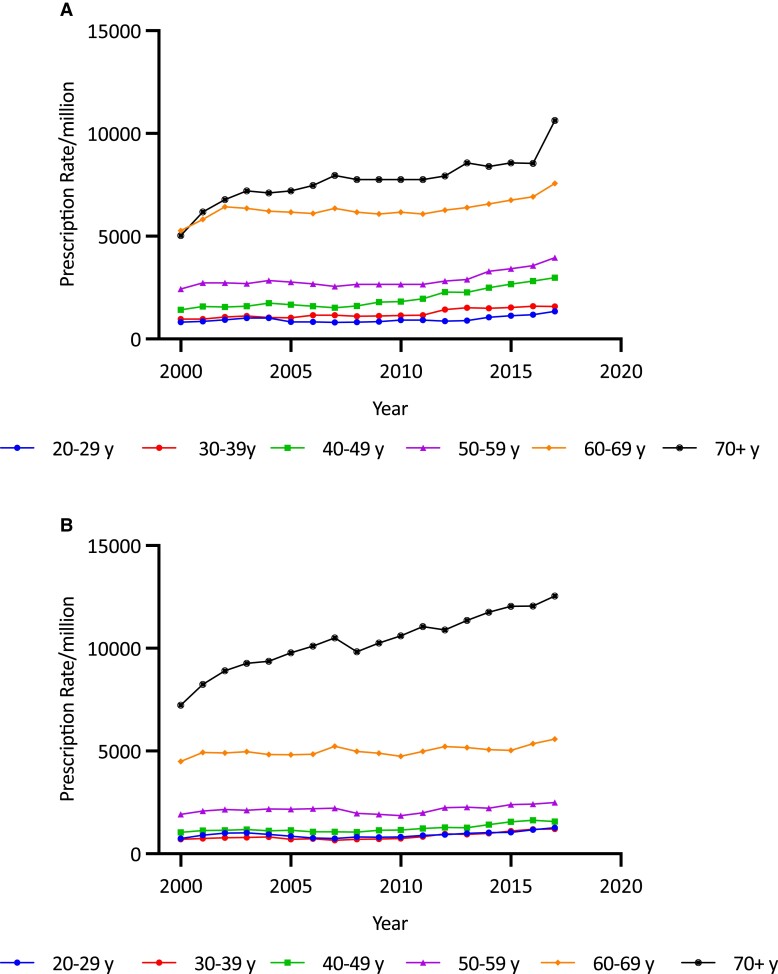
Figure 9.
A, Age-specific total glucocorticoid (GC) prescription rates per million in females by year, 2000/2001 to 2017/2018. Increases were seen broadly but particularly in older age groups, especially those older than 70 years. B, Age-specific total GC prescription rates per million in males by year, 2000/2001 to 2017/2018. Most of the increase was seen in men older than 70 years.

