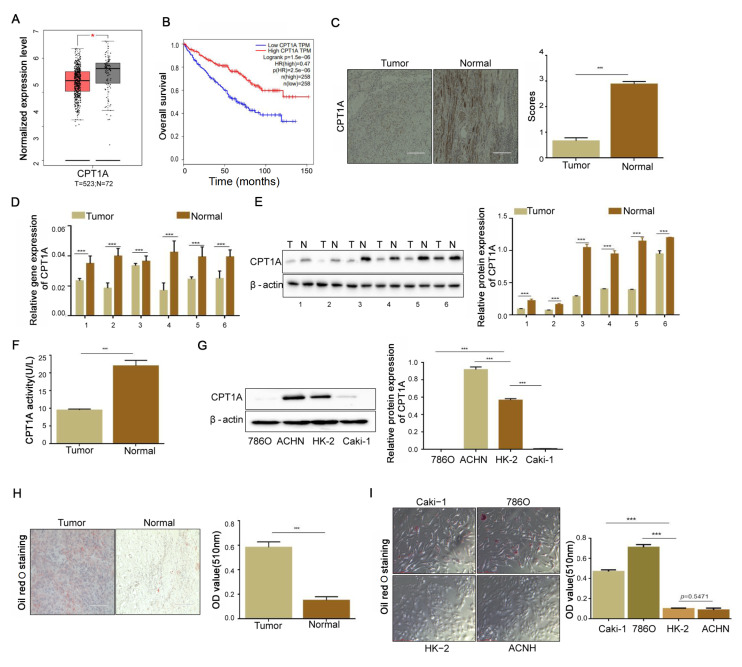
Figure1 .
Deficiency of CPT1A increases the lipid formation and cell proliferation in ccRCC(A) Analysis of CPT1A mRNA expression between ccRCC and adjacent tissues through the GEPIA website. (B) The TCGA database accessed through the UALCAN website was used to analyze the relationship between CPT1A expression and the patient survival rate. (C) The expression of CPT1A protein in ccRCC and adjacent tissues revealed by IHC. Scale bar = 50 μm. The percentage of tissue cores displaying low or high CPT1A staining in ccRCC tissues. (D) The RT-qPCR results obtained from 12 cases of ccRCC tissues and adjacent normal tissues showed that CPT1A mRNA expression is downregulated in ccRCC tissues. (E) Western blot analysis revealed a downregulation of CPT1A protein expression in ccRCC tissues. (F) The activity of CPT1A in ccRCC tissues comparing with that in normal tissues detected by ELISA kit. (G) Western blot analysis of CPT1A protein expression in one normal kidney epithelial cell HK-2 and three other RCC cells Caki-1, 786O and ACHN. (H) Lipid deposition in tumor and adjacent ccRCC tissues by Oil red O staining. Scale bar = 50 μm. (I) Lipid deposition in one normal kidney epithelial cell and three RCC cells identified by Oil red O staining. Scale bar = 50 μm. Values are shown as the mean±SD. ***P<0.001 (Student’s t-test).

