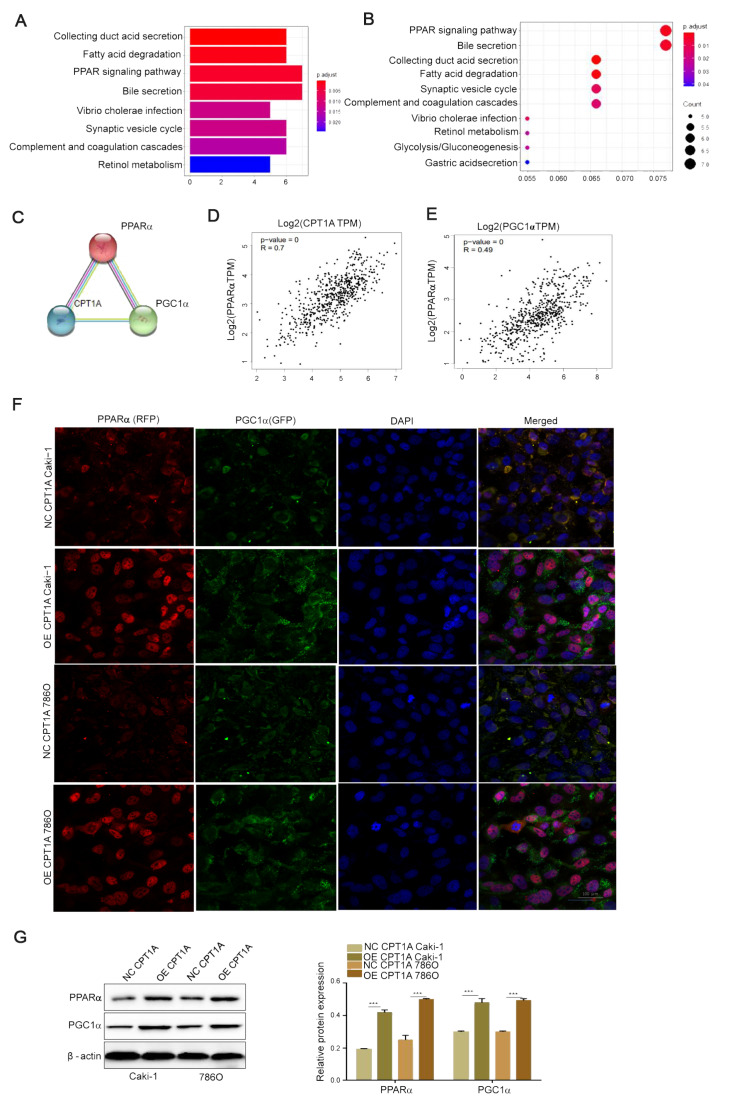
Figure4 .
The potential relationship among CPT1A, PPARα and PGC1α(A,B) KEGG and GO were used to map pathway database. KEGG pathways analysis of the genes in the top four modules. (C) The STRING website was used to analyze the interaction of proteins with CPT1A-related proteins. CPT1A was input into STRING, and the main cluster was formed. (D,E) Multiple genes correlation analysis between CPT1A and PPARα (R = 0.7) and between PGC1α and PPARα (R = 0.49) using GEPIA website. (F) The expressions of PPARα and PGC1α in CPT1A overexpression Caki-1 and 786O cells and their corresponding normal control cells detected by immunofluorescence assay. Scale bar = 100 μm. (G) The protein expressions of PPARα and PGC1α in CPT1A-overexpressing Caki-1, 786O cells and their corresponding normal control cell lines determined by western blot analysis. Values are shown as the mean±SD. ***P<0.001 (Student’s t-test).

