Figure 3.
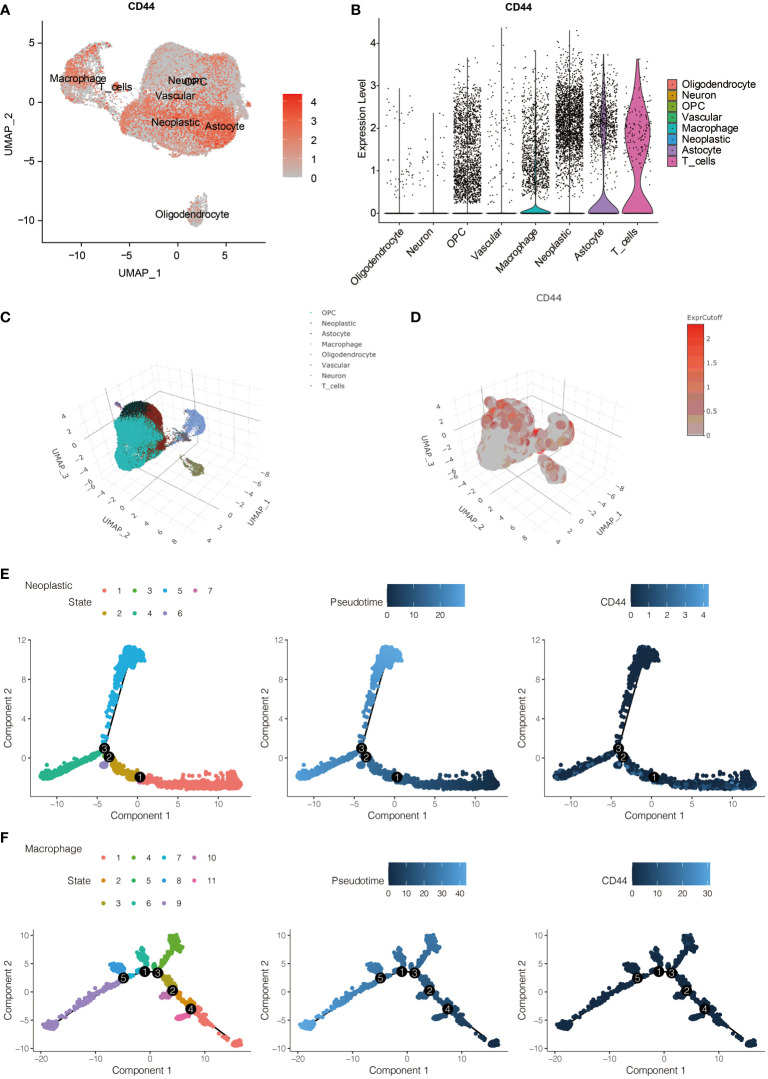
The expression pattern of CD44 at the scRNA-seq level. (A) The expression distribution of CD44 in eight types of identified cells. (B) The expression level of CD44 in eight types of identified cells. (C) Three-dimension plot of eight types of identified cells. (D) Three-dimension plot of the expression level of CD44 in eight types of identified cells. (E) The pseudotime trajectory analysis of glioma cells. (F) The pseudotime trajectory analysis of macrophages.

