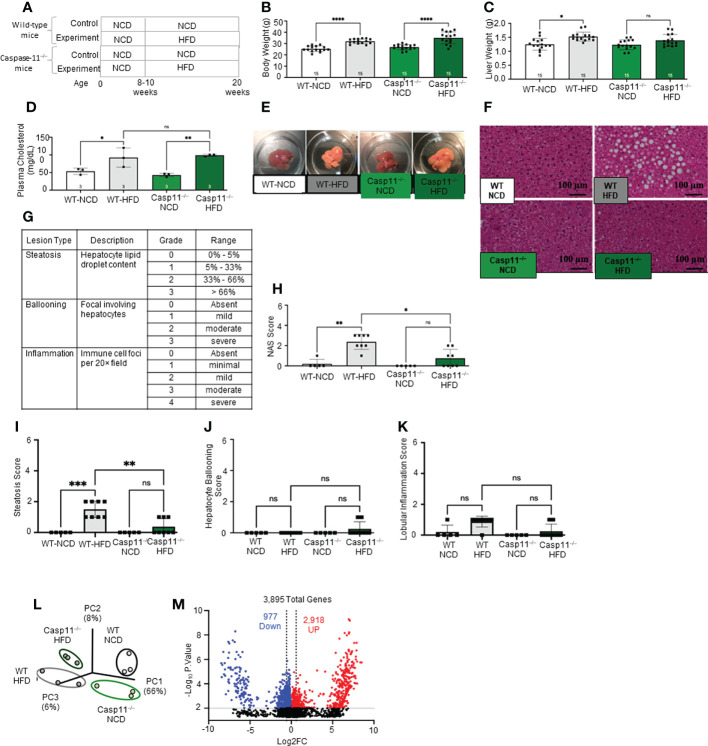
Figure 1.
High-fat diet (HFD) promotes non-alcoholic fatty liver disease (NAFLD) and Caspase-11 deficiency decreases lipid droplet, steatosis score, and NAS score in HFD-induced NAFLD but does not change liver weight or gross anatomic fatty liver pathology. (A) Experimental diet timeline. 8-10 weeks old Wild-type (WT) male mice and Caspase-11 deficient (Casp11–/–) mice were fed HFD or normal chow diet (NCD) for 12 weeks. (B) Body weight (n = 15). (C) Liver weight (n = 15). (D) Plasma cholesterol levels (n = 3). (E) Representative images showed that HFD feeding changed liver color to light yellow color. (F) Representative 20X images of hematoxylin and eosin (H&E) staining showing hepatic steatosis in 12-week HFD-fed WT and Casp11–/– male mice compared to 12-week NCD. Scale bar 100 µm. (G). Description and grades of NAS scare. NAFLD activity score analysis indicated that lipids accumulation as judged by liver steatosis and ballooning is precedent to liver inflammation. In grade 1, when steatosis reaches 5-33%, and ballooning reaches mild, inflammation is minimal. Steatosis was in the graded section as: are 0, steatotic; 0% to 1, 5% greater than 5% to 33% of hepatocytes are steatotic; 2, greater than 33% to as: 66%; 0, absent; and 3, 1, greater mild (focal; than 66%. involving Ballooning fewer than 3 hepatocytes); 2, moderate (focal and involving 3 or more hepatocytes or multifocal); and 3, severe (multifocal, with more than 2 foci of 3 or more hepatocytes). (0 or 1 Inflammation focus per 20× was field); graded 2, as: mild 0, (2 absent; foci); 3, moderate (3 foci); and 4, severe (4 or more foci per 20× field). (H) Total NAS score for WT-NCD (n = 5), WT-HFD (n = 8), Casp11–/–NCD (n = 5) and Casp11–/–HFD (n = 8). (I) Hepatic steatosis score. (J) Hepatocyte ballooning. (K) Lobular inflammation. (L) Principal component analysis (PCA) demonstrating that WT-NCD, WT-HFD, Casp11–/–NCD, and Casp11–/–HFD mice are transcriptionally distinct (n = 3). (M) Volcano plot analysis showed the 3895 differentially expressed genes (DEGs) in the WT liver of 12-week HFD compared to12-week NCD control. Among 3895 DEGs, 2918 genes were significantly upregulated (red), and 977 genes downregulated (blue). (FC) > 1.5 and p < 0.05. Statistical Analysis: Bulk RNA-Seq analysis was performed using Qlucore Omics Explorer. PCA plot generated using significantly differentially regulated genes). Volcano plot generated using GraphPad Prism with significantly differentially regulated genes. Statistical Analysis: One-Way ANOVA. *p < 0.05, **p < 0.001, ***p < 0.0001 ****p < 0.0001. ns, Non-significant.

