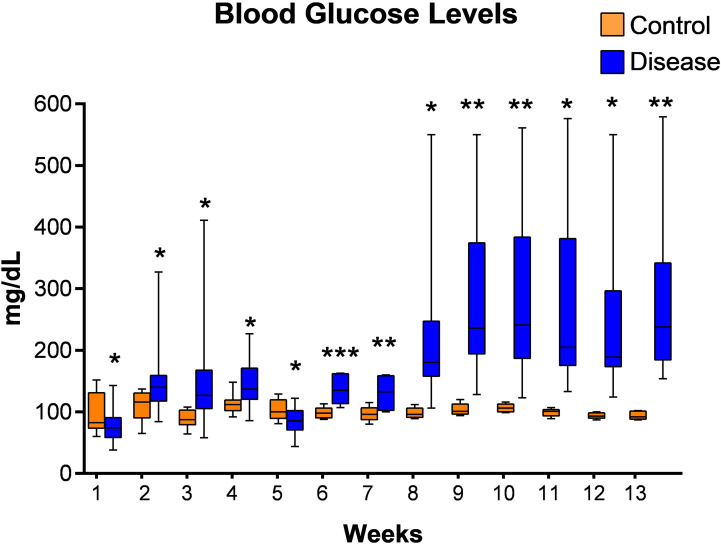
Figure 4.
Blood glucose levels of mice from latent tuberculosis with diabetes group after streptozotocin treatment. Values are Mean ± SE of 24 animals until week 6, and 8–22 animals from week 7 until week 13. *p ≤0.05, **p ≤0.01, ***p ≤0.001 as compared to the control group. Blue bars indicate the streptozotocin treated group (latent tuberculosis with diabetes) and orange bars indicate the control group (healthy group without TB infection or diabetes).

